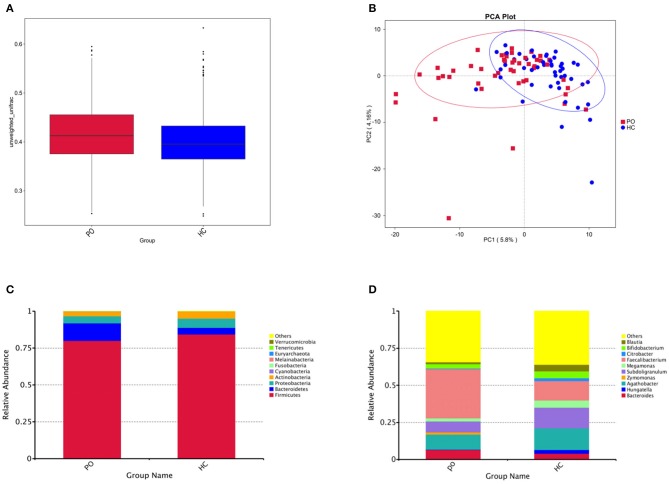
Figure 2.
(A) Box chart based on Beta diversity showed significant difference between the two groups. Abscissa represents Weighted Unifrac, Box plot response median, degree of dispersion, maximum, minimum, outliers. (B) Principal Component Analysis (PCA), the abscissa represents the first principal component, the percentage represents the contribution of the first principal component to the sample difference; the ordinate represents the second principal component, and the percentage represents the contribution of the second principal component to the sample difference; each point in the graph represents A sample (PC1 = 5.8%; PC2 = 4.16%) (Blue, HC; Red, PO). Cylindrical accumulation Map of relative abundance of species at Phylum level (C) and Genus level (D). The abscissa is grouping information; the ordinate represents Relative Abundance; others represents the sum of the relative abundances of all the phylums except the 10 phylums in the figure.

