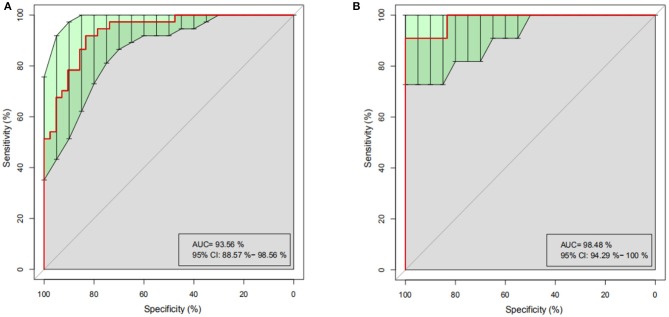
Figure 5.
Random Forest analysis. Based on the representative discriminant model of 20 dominant genera, PO and HC are effectively distinguished. (A) ROC Curve of training set, abscissa: specificity scale, ordinate: sensitivity scale. (B) ROC curve of test set, abscissa: specificity scale, ordinate: sensitivity scale. ROC, receiver operating characteristic; AUC, area under the ROC curve; CI, confidence interval.

