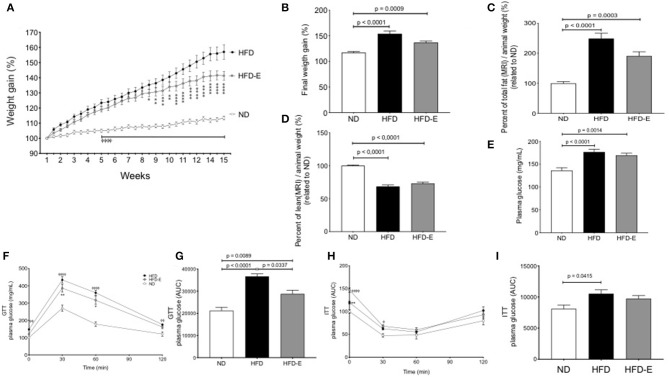
Figure 1.
Effects of eplerenone on body weight gain, body fat composition and glucose metabolism in mice. Three groups of mice (normal diet-fed mice, ND: white; high-fat diet-fed mice, HFD: black; HFD with implanted eplerenone-pellet mice, HFD-E: gray). (A) Body weight gain over 15 weeks (n = 20 per group) ⌽, p < 0.001 ND vs. HFD or HFD-E; *p < 0.001 HFD vs. HFD-E. (B) Final weight after 13 weeks of diet treatments. (C) Quantitation of total fat mass is shown (n = 12–15 per group). (D) Quantitation of total lean mass is shown (n = 12–15 per group). (E) Final fasting glucose is presented as the mean ± SEM of glucose (mg/mL). (F) GTT (1 g of glucose/kg body weight, i.p.) was conducted in 6 h-fasted mice, and the results are expressed as the mean percentage of initial glucose at t = 0. ⌽, p < 0.05 ND vs. HFD; *p < 0.05 HFD vs. HFD-E. (G) The mean glucose area under the curve (AUC) over the course of 120 min in each group is shown (n = 12–15 per group). (H) ITT (1 unit of insulin/kg body weight, i.p.) was conducted in 4 h-fasted mice. (I) The averaged AUC over the course of 120 min for each group is shown (n = 7–8 per group). Data are shown as the mean ± SEM ⌽, p < 0.05 ND vs. HFD; *p < 0.05 HFD vs. HFD-E. Graphs (B,C,D,E,G,H,I) were analyzed using Kruskal-Wallis and Dunn's tests; (A,F,H) via 2 way ANOVA and Tukey's tests. *p < 0.05; **p < 0.01; ***p < 0.001; ****p < 0.0001.

