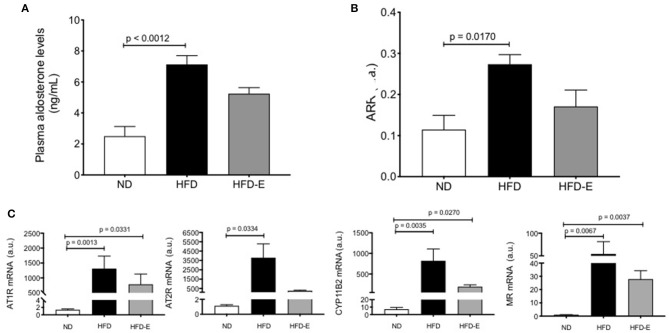
Figure 4.
Effects of eplerenone on aldosterone plasma levels and RAAS molecule expression in eWAT. Three groups of mice (normal diet-fed mice, ND: white bar; high-fat diet-fed mice, HFD: black bar; HFD + eplerenone mice, HFD-E: gray bar) were analyzed. Plasma aldosterone levels (A) and the aldosterone-renin ratio (B). mRNA expression levels of AT1R, AT2R, CYP11B2, and mineralocorticoid receptor (MR) genes in the eWAT of each group are shown (C). Data are represented as the mean ± SEM. P < 0.05 was considered significant. Graphs (A–C) were analyzed using Kruskal-Wallis and Dunn's tests.

