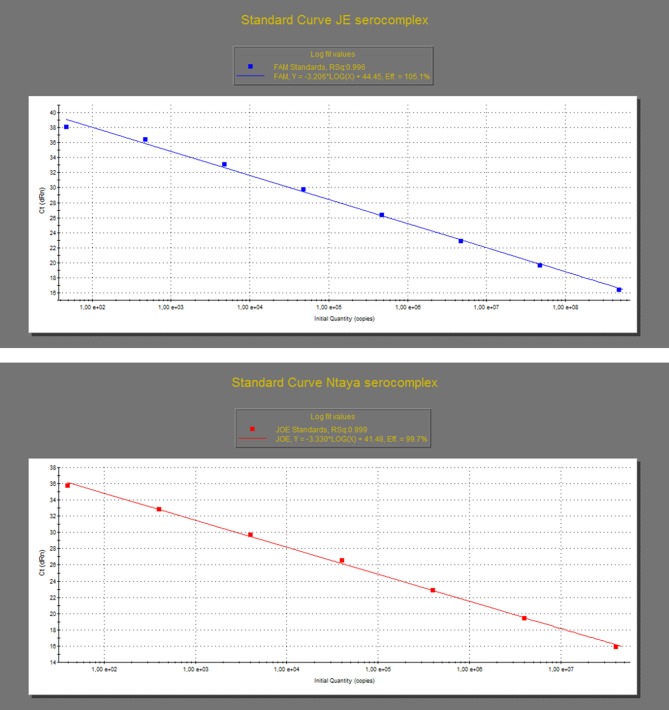
Figure 1.
Standard curves of the dRRT-PCR for the detection of JE (top graph) and Ntaya flavivirus serocomplexes (bottom graph). The curves were generated by analysis of triplicates of 10-fold serial dilutions of the quantified in vitro-transcribed WNV (top graph) and BAGV (bottom graph) RNA standards produced as synthetic positive controls. Each ▪ corresponds to the mean value of three replicates.

