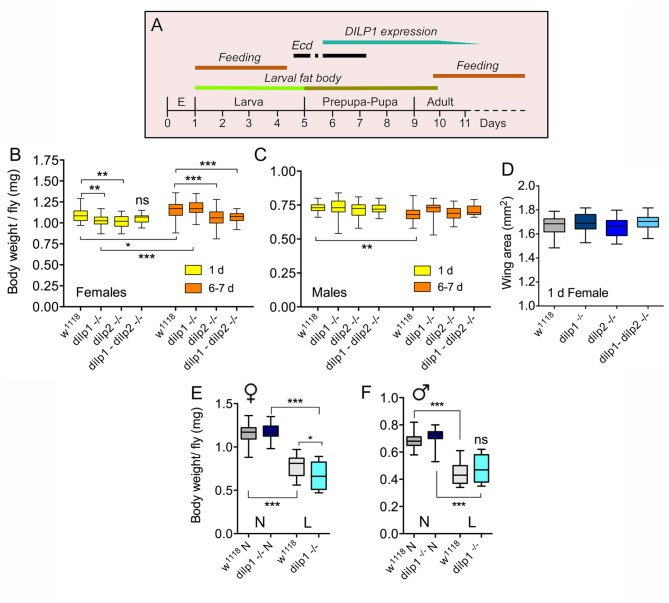
Figure 1.
dilp1 mutant flies display reduced body weight, but are not smaller. (A) Expression profile of dilp1/DILP1 in Drosophila. Note that expression of transcript and peptide coincides with the non-feeding pupal stage and the first days of adult life when food intake is reduced (especially day one). It also times with the onset of the second and third ecdysone (Ecd) surges in the early pupa (earlier ecdysone peaks are not shown). E, embryo. (B) Body weight of female flies 1 day and 6–7 days after adult eclosion. dilp1 mutant flies display reduced body weight when 1 day old, but gain substantially the first week. Also, dilp2 mutants weigh less, but do not gain much weight the first week. The double mutants are not significantly affected compared to controls at 1 day, but after 6–7 days, both dilp2 and double mutants weigh less that controls and dilp1 mutants. Data are presented as medians ± range, n = 25–30 flies for each genotype from three independent replicates (*p < 0.05, **p < 0.01, ***p < 0.001, ns, not significant; two-way ANOVA followed by Tukey's test). (C) In male flies, the three mutants display weights similar to controls and controls lose weight the first week. Data are presented as medians ± range, n = 18–30 flies for each genotype from three independent replicates (**p < 0.01, two-way ANOVA followed with Tukey's test). (D) Wing area was used as a proxy for organismal growth. The three mutants did not display altered wing size. Data are presented as medians ± range, n = 16–23 flies for each genotype from three independent replicates (one-way ANOVA followed with Tukey's test). (E,F) Body weight of 7-day-old flies that had been exposed to normal diet (N) or low protein diet (L) during late larval stage. The female dilp1 mutant flies displayed lower body weight than controls after low protein. Data are presented as medians ± range, n = 17–29 flies for each genotype from three replicates (*p < 0.05, ***p < 0.001, one-way ANOVA followed by Tukey's test).

