
Figure 3.
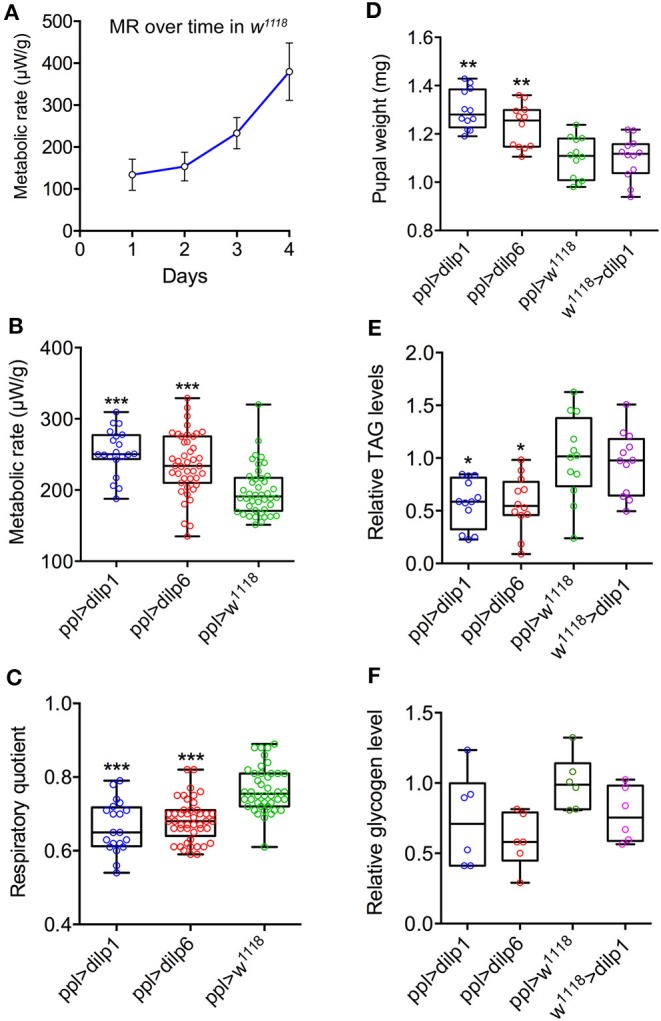
Metabolic rate trajectories and respiratory quotients (RQs) during pupal development respond to dilp1 and dilp6 overexpression in the fat body. (A) Metabolic rate in w1118 flies increased exponentially as a function of time. For the ensuing overexpression analysis, we studied the period 96–120 h after pupation. Data are presented as means ± S.E.M, n = 20–47 flies from three independent replicates. (B) Metabolic rate was significantly elevated during this period in dilp1 and dilp6 overexpression flies (ppl-Gal4) when compared to w1118 flies. Data are presented as means ± S.E.M, n = 20–47 flies for each genotype from three independent replicates (***p < 0.001, compared to w1118 flies, as assessed by two-way ANOVA followed with Tukey's test). Data are from both males and females as no difference was found in the ANOVA for sex. (C) RQ, reflecting catabolic energy substrate, was significantly lower in the overexpression flies when compared to the control flies and indicates a shift from mixed fuel catabolism (RQ = 0.7–0.8) to predominantly lipid catabolism (RQ < 0.7). Data are presented as means ± S.E.M, n = 20–47 flies for each genotype from three independent replicates (***p < 0.001, compared to w1118 flies, as assessed by one-way ANOVA followed with Tukey's test). Data are from both males and females as no difference was found in the ANOVA for sex. (D) Four-day-old pupae (mixed male and female) were weighed (wet weight) before extraction and TAG determination. Overexpression of dilp1 and dilp6 both resulted in increased pupal weight. (E) Levels of TAG were measured in the pupae used for weighing in D. Overexpression of each dilp resulted in decreased TAG levels. (F) Glycogen levels in 4-day-old pupae (no significant changes). In (D,E), 12 replicates per genotype with 4 pupae in each replicate (each data point represents 4 pupae); in (F), 6 replicates per genotype with 4 pupae in each replicate (*p < 0.05, **p < 0.01, one-way ANOVA followed by Tukey's test).