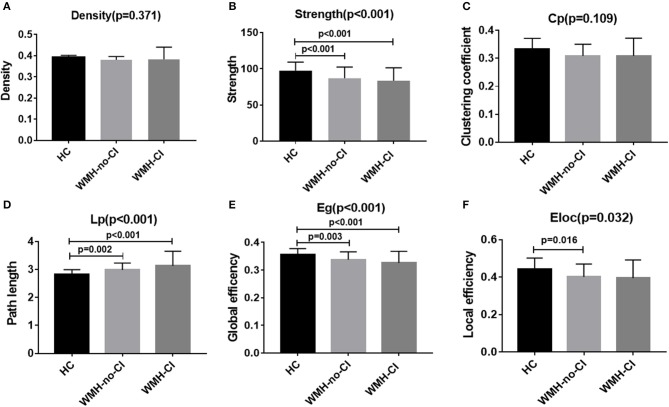
Figure 1.
Bar graph of group differences on the whole-brain network properties. Data were presented as mean ± SD. (A,C) No significant difference in network density and clustering coefficient among the three groups (ANCOVA, P > 0.05). (B,E) WMH-no-CI and WMH-CI groups displayed lower network strength and global efficiency than HC group (ANCOVA, P < 0.001; Bonferroni-corrected, P < 0.05/3). (D) WMH-no-CI and WMH-CI groups displayed higher path length than HC group (ANCOVA, P < 0.001; Bonferroni-corrected, P < 0.05/3). (F) WMH-no-CI group displayed lower local efficiency than HC group (ANCOVA, P < 0.05; Bonferroni-corrected, P < 0.05/3). Cp, clustering coefficient; CI, cognitive impairment; Eg, global efficiency; Eloc, local efficiency; HC, healthy controls; Lp, path length; WMH, white matter hyperintensity.

