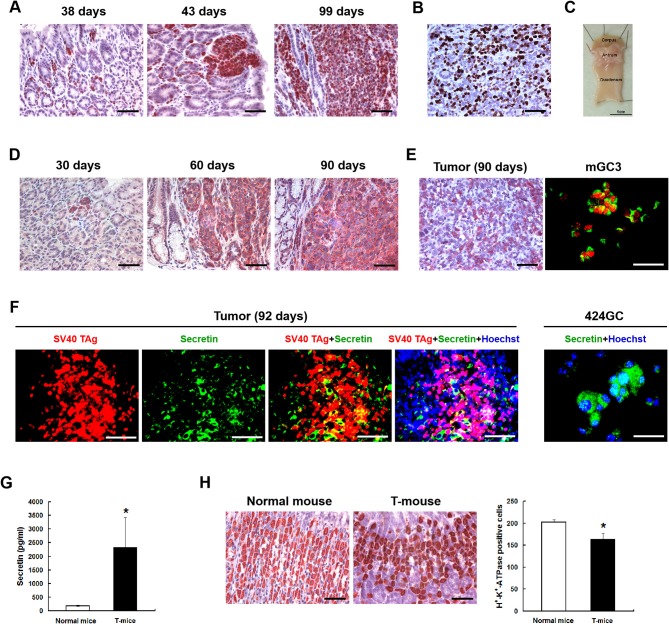
Figure 1.
The neuroendocrine phenotype of the CEA424-SV40 T antigen transgenic mouse model. (A) Immunohistochemistry for SV40-TAg was applied to stomach sections from mice of different age to identify the tumor areas. (B) Ki67 staining in the tumor area of a 107 days old mouse. Macroscopic picture of the stomach from this mouse was shown in (C,D) Immunohistochemistry for chromogranin B on stomach sections from 30, 60, and 90 days old CEA424-SV40 TAg transgenic mice. (E) Left: immunohistochemistry for glucagon on stomach section from a 90 days old CEA424-SV40 TAg transgenic mouse. Right: SV40 TAg and glucagon double staining on cell line mGC3. SV40 TAg: red (Alexa-546); glucagon: green (Alexa-488). (F) Left: SV40 TAg and secretin double staining on stomach section from a 92 days old CEA424-SV40 TAg transgenic mouse. Right: immunofluorescent staining for secretin in cell line 424GC. SV40 TAg: red (Alexa-546); secretin: green (Alexa-488); nuclei were stained with Hoechst 33342. (G) ELISA analysis of secretin level in the plasma of 90-days-old CEA424-SV40 TAg mice and non-transgenic mice. T-mice: CEA424-SV40 TAg transgenic mice; n = 4 in each group; *p < 0.05 vs. control. (H) As secretin functions as a feedback inhibitor of gastric acid secretion, elevated secretin hormone level leads to reduced acid producing cell numbers. Left: immunohistochemical staining for H+-K+-ATPase on stomachs of CEA424-SV40 TAg transgenic mice and normal mice. Right: statistical analysis for H+-K+-ATPase positive cell number. n = 5 in each group, *p < 0.0005 vs. control. Scale bars in the staining pictures: 50 μm.

