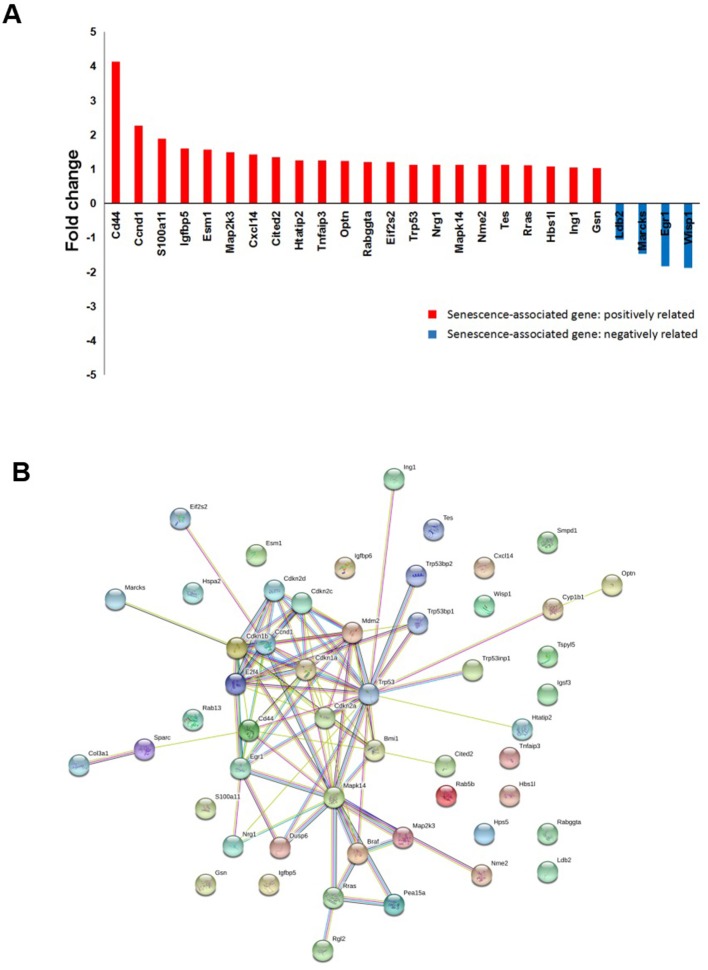
Figure 6.
microarray analysis on tumor tissue samples for senescent signature. (A) cDNA-array analysis in the tumor tissues from RAD001 treated mice and control mice showed a slight induction of senescence associated genes (p < 0.05: RAD001 treated group vs. control group). (B) Senescent related genes differentially expressed between control group and RAD001 treated group (p < 0.05) were selected for STRING analysis. Protein-protein interaction was shown.

