Figure 7.
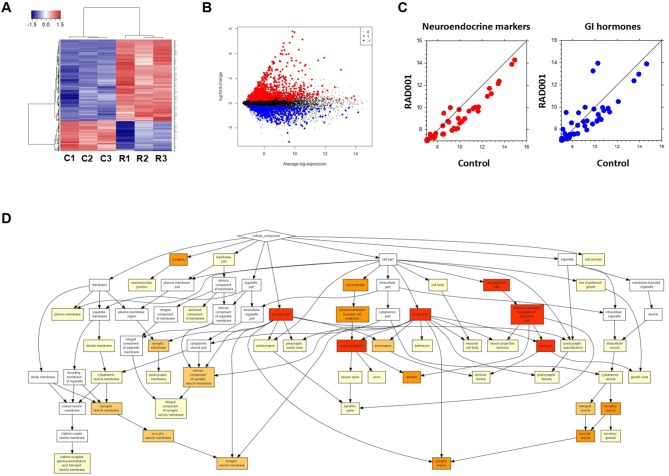
Microarray analysis on tumor tissue samples from mice treated with RAD001 or placebo. (A) Transcriptome analysis in the tumor tissue samples by cDNA-array. Three samples from each group were included. C, control mouse treated with placebo; R, mice treated with 10 mg/kg RAD001. Gene expression was analyzed by cluster 3.0 and TreeView. (B) From the whole array, 1,344 genes show differential expression between control group and RAD001 treated group (p < 0.05: RAD001 treated group vs. control group). Red: up-regulated for more than 2 folds; blue: down-regulated for more than 2 folds; black: fold change between −2 and 2. (C) A down regulation of genes specific for neuroendocrine tumors and gastrointestinal hormones was observed in mice treated with RAD001 comparing to control mice. Data are expressed as exponent only (log2). A position left from the diagonal indicates an increase, on the right an inhibition after RAD001 treatment. (D) GO analysis showed an enrichment of neuroendocrine related genes in the term of Cellular Component (CC).

