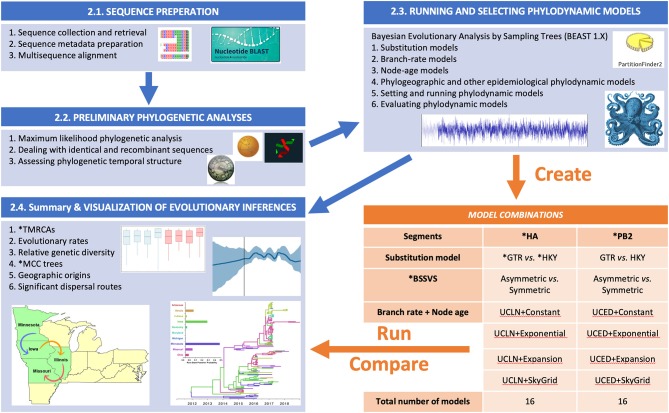
Figure 1.
Flow chart showing the steps for our Bayesian phylodynamic statistical framework. Blue boxes summarize the methodological steps for the statistical framework described in the BAYESIAN PHYLODYNAMIC STATISTICAL FRAMEWORK section of the main text (Sequence Preparation section to Summary and Visualization of Evolutionary Inferences section). The orange table indicates the generated models for swine influenza example data described in Section Worked Example: Evolutionary Dynamics of Swine Influenza in the United States Between 2015 and 2018. ML, maximum likelihood; RDP, Recombination Detection Program; ESS, effect sample size; BF, Bayes factor; PS, path sampling; SS, stepping stone; HA, hemagglutinin; PB2, polymerase basic 2; GTR, general time-reversable; HKY, Hasegawa, Kishino, and Yano; BSSVS, Bayesian Stochastic Search Variable Selection; TMRCAs, Time to the Most Recent Common Ancestor; MCC, Maximum Clade Credibility.

