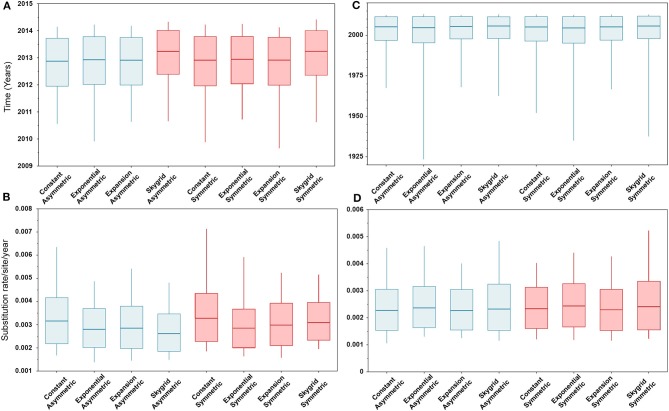
Figure 2.
Box plots of divergence times and evolutionary rates (substitution rate/site/year) of hemagglutinin (HA) and polymerase basic 2 (PB2) gene segments of human-like H3 swine influenza virus collected between January 2015 and June 2018 in the United States. The boxplots summarize the posterior estimates of eight phylodynamic model combinations (node-age and BSSVS priors) for each gene segment. Boxes represent 95% high posterior density (HPD), and midlines indicate the posterior median for each estimate. Blue and red boxes indicate symmetric and asymmetric models, respectively. (A) Divergence times of HA gene. (B) Substitution rates/site/year of HA gene. (C) Divergence times of PB2 gene. (D) Substitution rates/site/year of PB2 gene.

