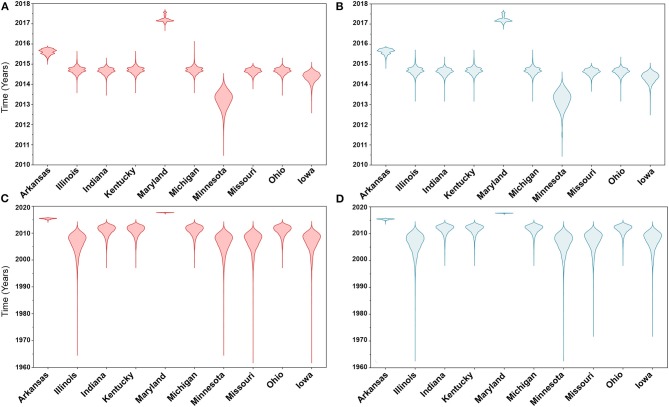
Figure 3.
Violin plots of state level time to the most recent common ancestors (TMRCA) of hemagglutinin (HA) and polymerase basic 2 (PB2) gene segments of human-like H3 swine influenza virus collected between January 2015 and June 2018 in the United States. The plots were generated from the Skygrid coalescent tree model. Red and blue colors indicate the asymmetric and symmetric BSSVS priors, respectively. (A) TMRCAs of HA gene estimated from the asymmetric BSSVS model; (B) TMRCAs of HA gene estimated from the symmetric BSSVS model; (C) TMRCAs of PB2 gene estimated from the asymmetric BSSVS model; (D) TMRCAs of PB2 gene estimated from the symmetric BSSVS model.

