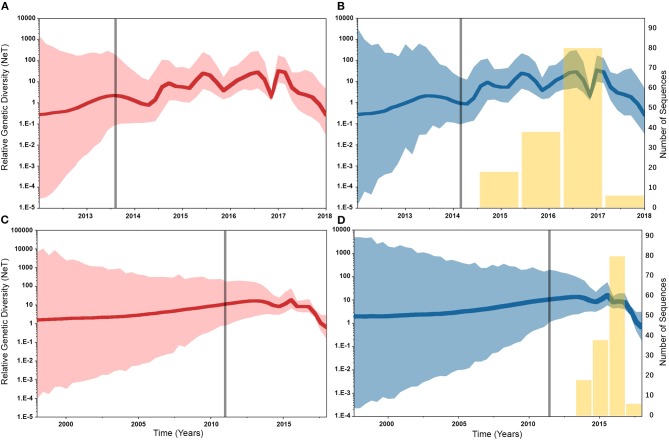
Figure 4.
Bayesian Skygrid (SG) plots of the relative genetic diversity through time of hemagglutinin (HA) and polymerase basic 2 (PB2) segments of human-like H3 swine influenza virus collected between January 2015 and June 2018 in the United States. The dark line indicates the posterior median estimate, and the 95% high posterior density (HPD) is indicated by the light shaded areas (red and blue for the asymmetric and symmetric BSSVS priors, respectively). The vertical gray line indicates the estimated time at which the relative genetic diversity transitioned from a slow to a fast growth rate. Yellow bars indicate the temporal distribution of the sequence data. (A) SG plot of HA gene inferred from the asymmetric BSSVS prior. (B) SG plot of HA gene inferred from the symmetric BSSVS prior. (C) SG plot of PB2 gene inferred from the asymmetric BSSVS prior; (D) SG plot of PB2 gene inferred from the symmetric BSSVS prior.

