FIGURE 2.

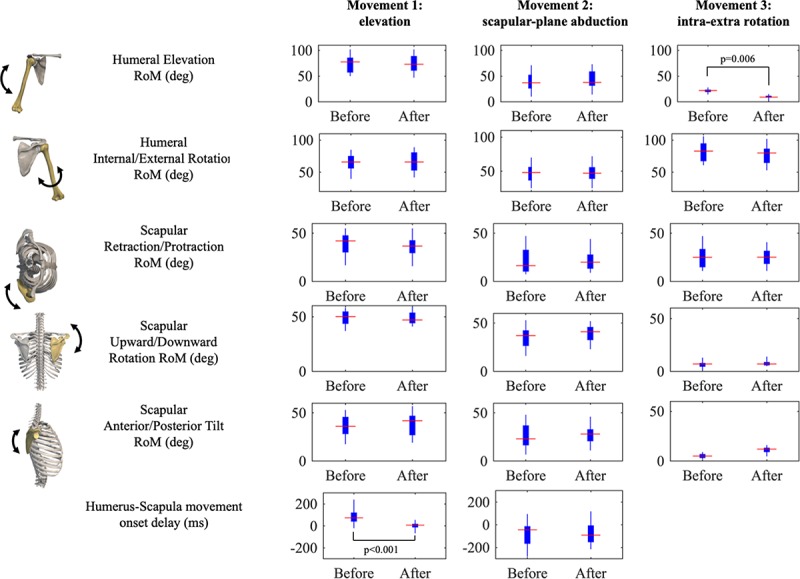
Results of joints Ranges of Motion (RoM) and Humerus-Scapula movement onset delay presented as boxplots for each movement (rows). Significant post hoc tests are reported.

Results of joints Ranges of Motion (RoM) and Humerus-Scapula movement onset delay presented as boxplots for each movement (rows). Significant post hoc tests are reported.