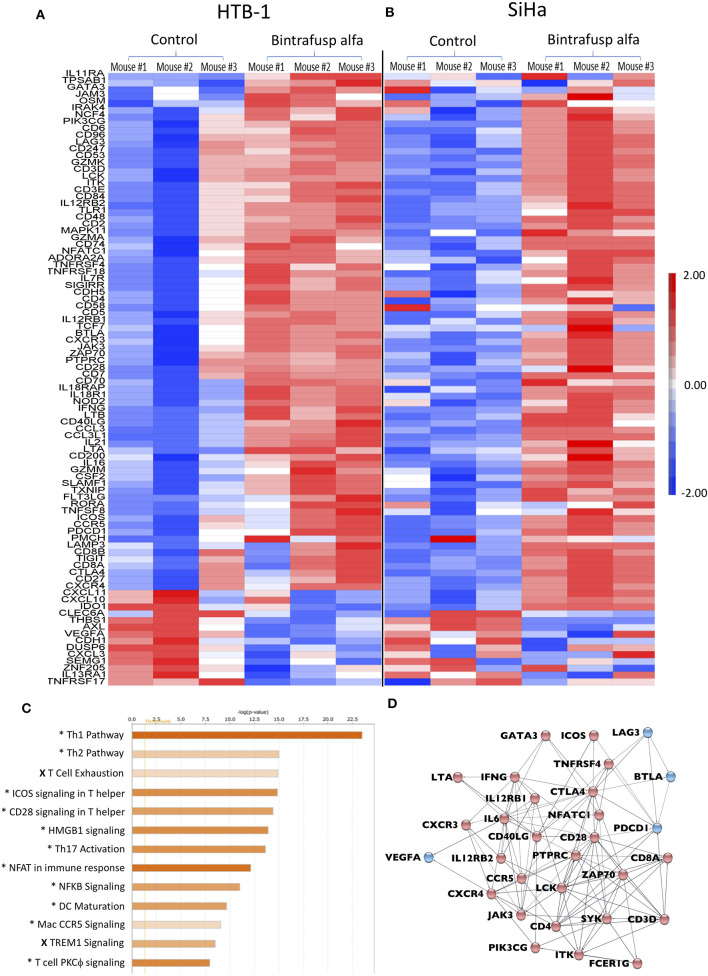
Figure 6.
Distinct transcriptional changes within the TME following bintrafusp alfa treatment. (A,B) Heatmap RNA expression profile from a NanoString pan-cancer immune profiling panel assayed on enriched CD45+ cells from tumors of control and bintrafusp alfa-treated mice bearing HTB-1 tumors at day 21 post-initiation of bintrafusp alfa treatment (A) or SiHa tumors at day 22 post-initiation of bintrafusp alfa treatment (B) (fold change >1.5, ANOVA p < 0.1). (C) Ingenuity pathway analysis of HTB-1 and SiHa RNA expression profiles describing those pathways most altered with bintrafusp alfa treatment; (*) denotes pathways altered in both HTB-1 and SiHa tumors; (X) denotes pathways altered in SiHa tumors only. (D) String analysis of those genes altered in the top 5 pathways identified by Ingenuity Pathway Analysis. Red nodes denote those genes/pathways identified post-bintrafusp alfa treatment in both HTB-1 and SiHa tumors; blue nodes denote those genes/pathways identified post-bintrafusp alfa treatment in SiHa tumors only.

