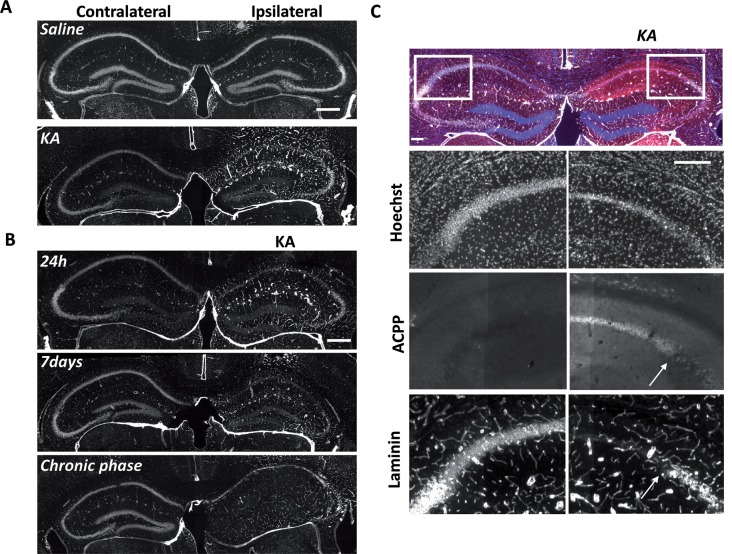
Figure 5.
Uptake of ACPP is superimposed to loss of neuronal laminin in KA treated brain. (A) Laminin immunoreactivity in saline or KA-injected hippocampus 24 h after injection. (B) Progressive changes of laminin expression during the different phases of epileptogenesis. (C) Magnification of laminin loss in CA1–CA2 region 7 days after KA injection. The white arrow shows the limit between ACPP uptake and intact laminin (right panels), whereas no TAMRA fluorescence is detectable in the contralateral side and laminin is intact. TAMRA ACPPs (red), Laminin (white), Hoechst (blue). Scale bars: (A,B) 500 μm, (C) 200 μm.

