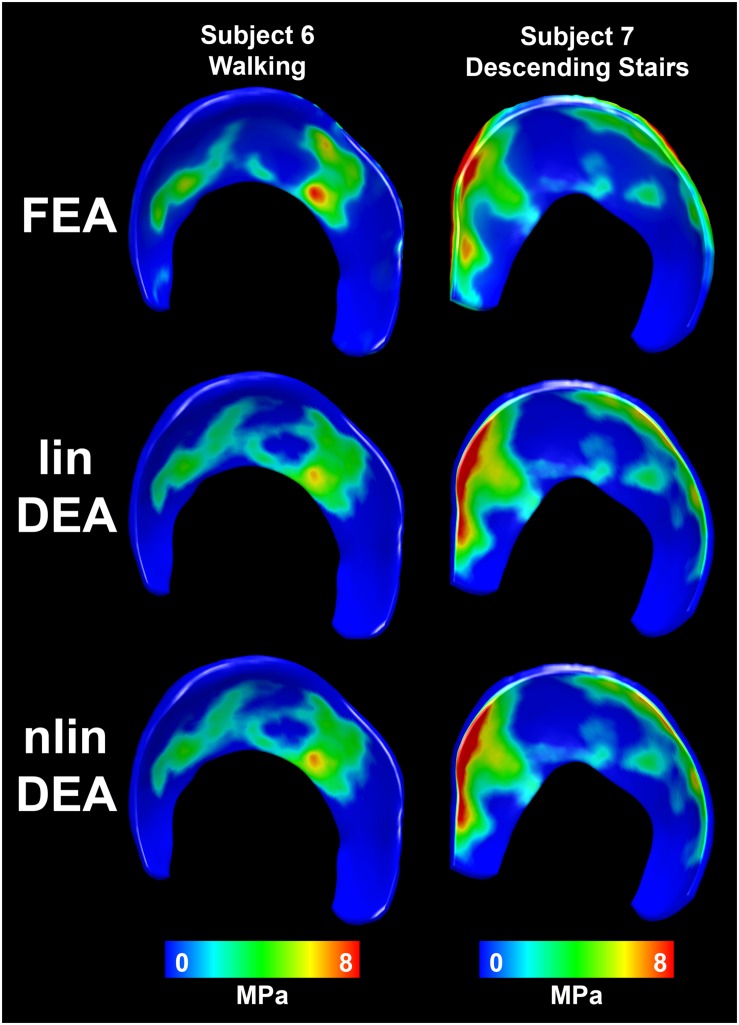
FIGURE 4.
Distribution of contact stresses on the acetabular cartilage estimated with the reference FEA (top row), linear DEA (middle row) and non-linear DEA (bottom row). The overall contact patterns as well as the magnitude of the contact stresses corresponded well between both DEA techniques and FEA. Identical cartilage geometry, obtained by manual segmentation for each subject, was used in all three numerical methods.

