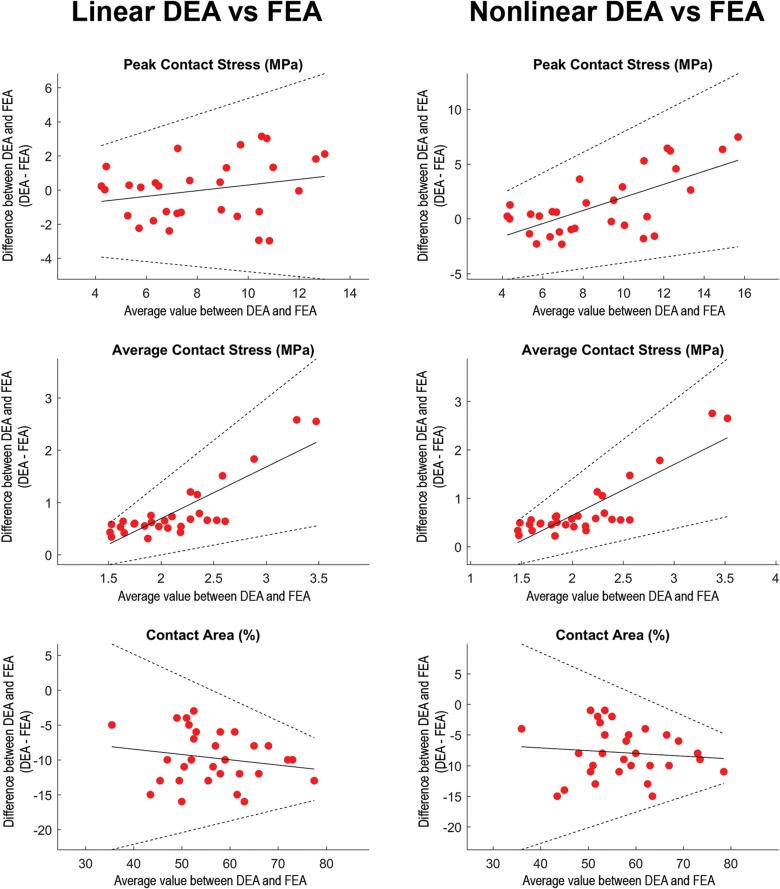
FIGURE 5.
Regression-based Bland-Altman plots comparing linear DEA (column 1) and non-linear DEA (column 2) with FEA. The difference (DEAi–FEAi) between both methods was plotted as a function of the average for each of the loading scenarios (represented by dots). Solid lines represent the regression line and its 95% confidence limits (Bland and Altman, 1999). In loading situations with high articular peak stresses calculated with FEA, the non-linear DEA tended to overestimate peak stress. Overall, the average contact stresses (middle row) were higher in the DEA models. In loading scenarios with high average contact stresses, both linear as well as non-linear DEA increasingly overestimated average contact stresses. The contact area (lower row) from the linear and non-linear DEA models consistently under-predicted contact area estimated by FEA. Identical cartilage geometry, obtained by manual segmentation for each subject, was used in all three numerical methods.

