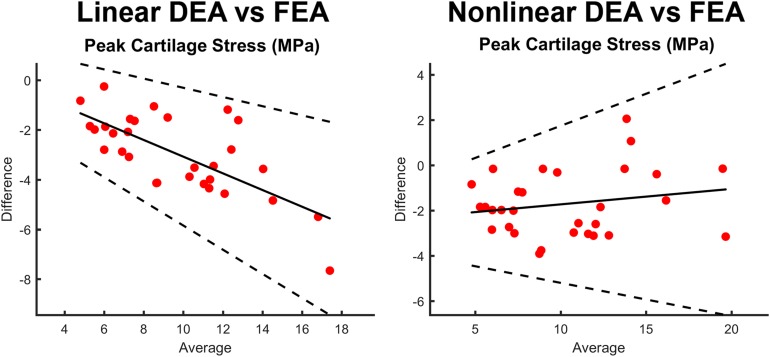
FIGURE 8.
Bland-Altman plots comparing peak stress through the entire thickness of cartilage in the FEA model as compared to the contact stress reported by the linear DEA (left) and non-linear DEA (right) models. The non-linear and linear DEA models yielded similar predictions in cases with low peak stresses. However, in loading positions with high peak stresses, the non-linear DEA definition yielded more accurate predictions.

