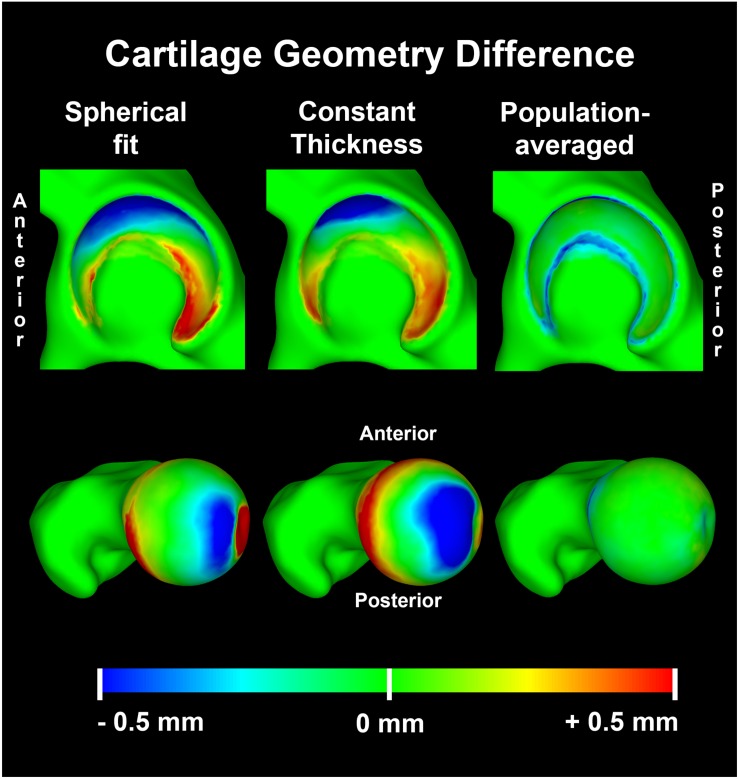
FIGURE 9.
Average distance difference in predicted cartilage geometry compared to the reference cartilage geometry visualized on a template acetabulum and proximal femur. The population averaged method provided the most accurate predictions of cartilage thickness, with errors confined to the periphery of both the acetabular and femoral cartilage.

