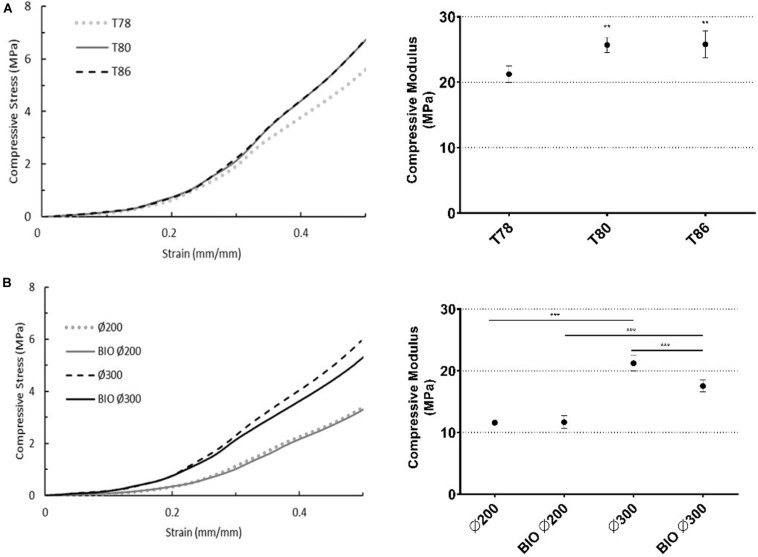
FIGURE 4.
Scaffold compression properties (n = 3). (A) Influence of nozzle temperature [78–86°C]. (B) Influence of filament diameter [∅200 and ∅300] and the surrounding environment (37°C) [BIO ∅200 and BIO ∅300]. Typical stress-strain curve (left) for each sample and respective compression modulus, calculated by the slope of the linear region (right). Statistical differences are presented by **p < 0.01 and ***p < 0.001.

