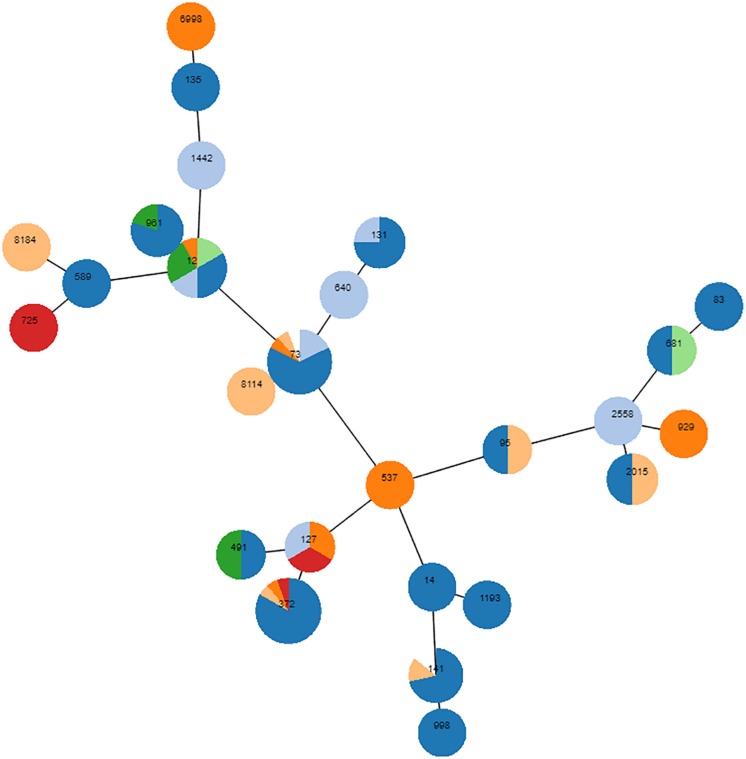
FIGURE 1.
Phylogenetic proximity of 89 randomly chosen B2 isolates, as inferred using goeBURST (phyloviz). Each circle is a pie chart showing the pathologies from which the isolates were obtained. Digestive disease is colored in red, UTIs in dark blue, unknown pathology in light blue, skin infection in orange, otitis in light orange, reproduction disorder in green, respiratory disease in light green. The node size of the goeBURST is proportional to the number of isolates. Nodes are in log scale. Scaling factor = 2.

