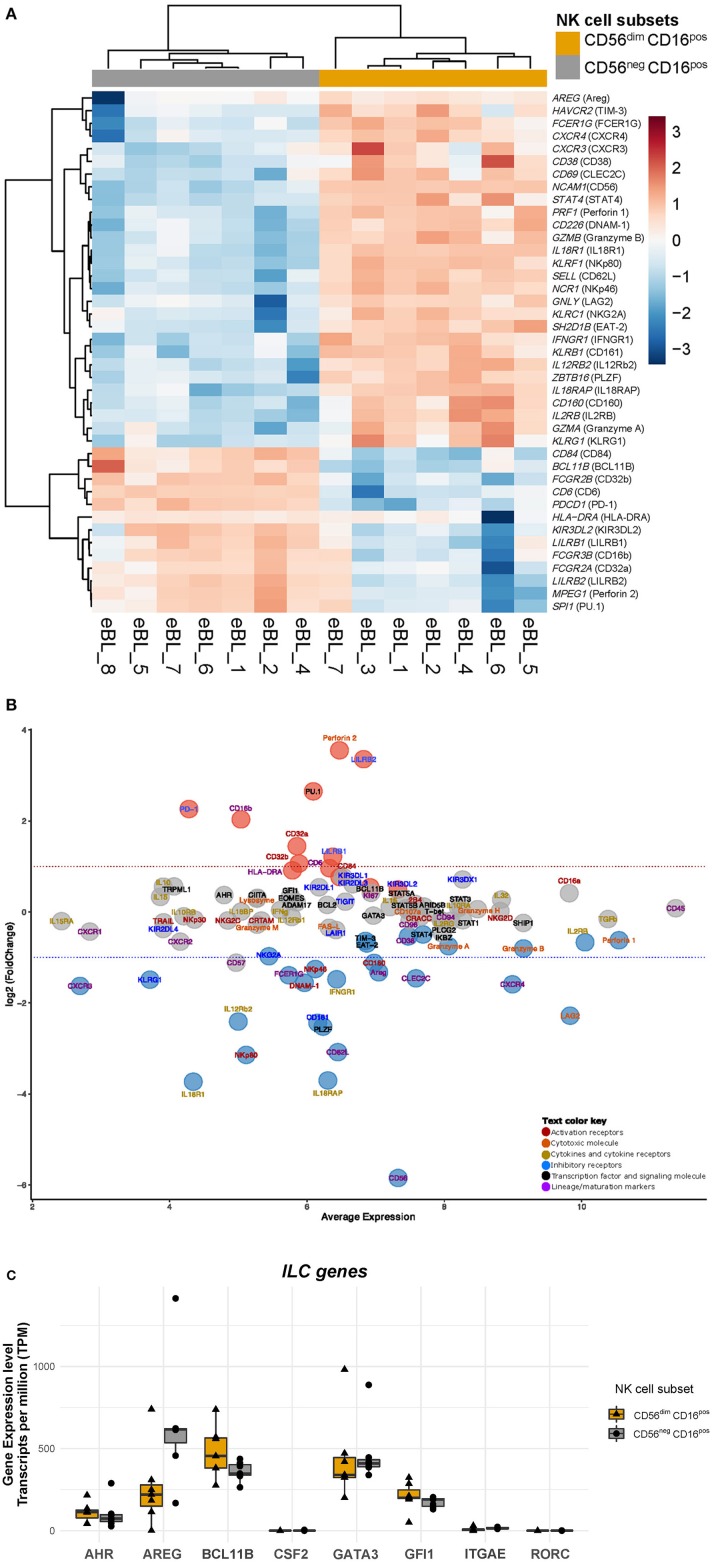
Figure 2.
Heatmap and MA plot of selected differentially expressed genes associated with NK cell function. (A) Heatmap of selected NK cell genes comparing CD56negCD16pos and CD56dimCD16pos NK cells. The id between the brackets are the protein name for that particulate gene, i.e., gene symbol (protein name), NCAM1 (CD56). (B) MA plot of differential expression analysis between CD56negCD16pos and CD56dimCD16pos NK cell subsets. The MA plot illustrates a log2 fold change of NK specific gene expression in CD56negCD16pos relative to CD56dimCD16pos cells and the average normalized expression counts of genes expressed by CD56negCD16pos cells. Protein names are used in the MA plot for ease of comparison to flow data even though these results are for gene expression. The Red dots indicate genes that have significantly higher expression in CD56negCD16pos relative to CD56dimCD16pos NK cells (with BH-adjusted p-value < 0.01 and FDR < 0.05), whereas blue dots indicate genes that have significantly lower expression (with BH-adjusted p-value < 0.01 and FDR < 0.05), and gray dots are genes that are similarly expressed. (C) Boxplot of gene expression profiles that define Innate Lymphoid Cells (ILCs): AHR, AREG, BCL11B, CSF2, GATA3, GFI1, IRGAE, RORC comparing CD56negCD16pos relative to CD56dimCD16pos NK cells.

