FIGURE 5.

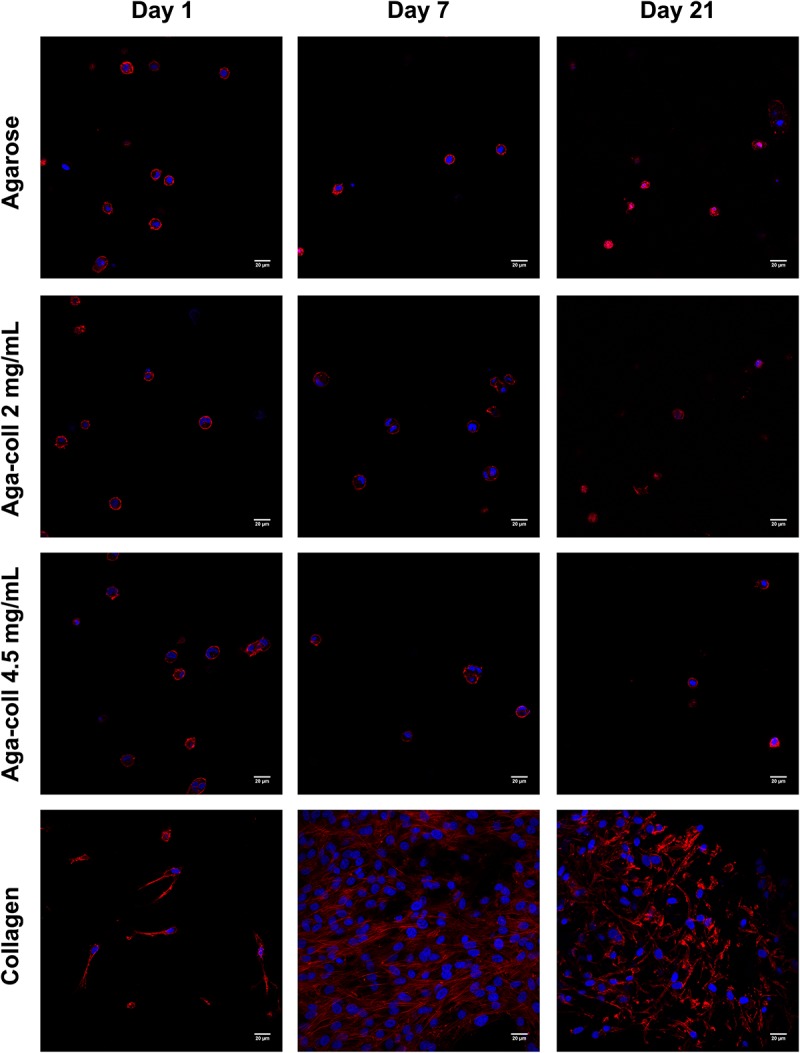
Representative images of cell morphology (red = phalloidin, blue = DAPI) of agarose, agarose-collagen 2 mg/mL, agarose-collagen 4.5 mg/mL, and collagen hydrogels at days 1, 7 and 21 after fabrication. Scale bar = 20 μm.

Representative images of cell morphology (red = phalloidin, blue = DAPI) of agarose, agarose-collagen 2 mg/mL, agarose-collagen 4.5 mg/mL, and collagen hydrogels at days 1, 7 and 21 after fabrication. Scale bar = 20 μm.