FIGURE 3.
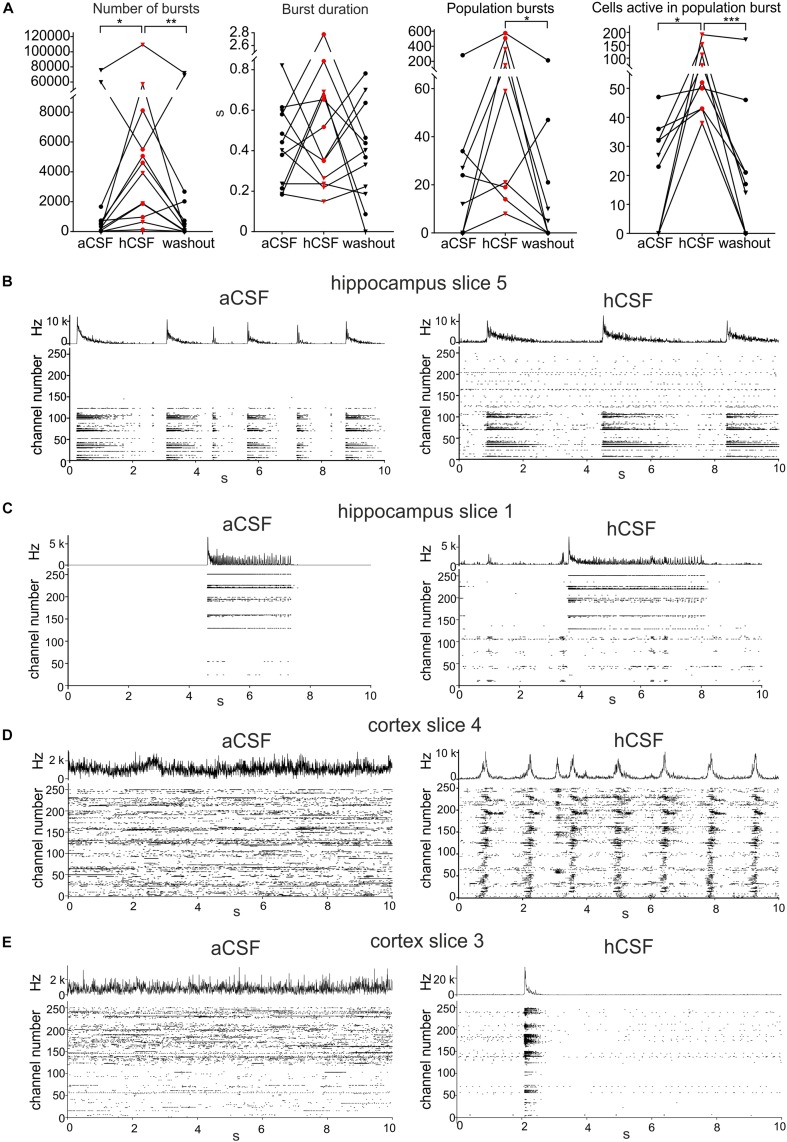
Human CSF promotes synchronized activity. (A) The number of bursts detected in single electrodes increased when hCSF was washed in and decreased back toward aCSF baseline levels when hCSF was washed out again (each hippocampus slice represented by a circle and each cortex slice as a triangle). Burst duration did not change when hCSF was washed in. The number of population bursts increased in all cortical slices (triangles) and in two of the hippocampal slices (circles) following hCSF wash in and then decreased in all slices but one (hippocampal) during the washout. The number of cells (measured by number of active electrodes) participating in population bursts increased in all slices during hCSF and then decreased back toward baseline levels during washout. Significance is indicated by ∗p < 0.05; ∗∗p < 0.01; ∗∗∗p < 0.001. (B–D) Representation of different activity patterns recorded in aCSF (left) and hCSF (right) (B) Activity pattern from hippocampus slice 5 (see heat-map in Figure 1D). Upper panels: Summarized spike rate trace. Lower panels: Raster plots showing the activity on all 252 recording channels. Comparison of the raster plots (aCSF vs hCSF) reveals additional active channels in hCSF, which record continuous but not bursting activity. (C) Activity patterns from hippocampus slice 1 (heat-map in Figure 1D). Comparison of the raster plots reveals additional channels in hCSF, which record bursting activity in a new area of the slice (channel number 1–100). (D) Activity patterns from cortex slice 4 (heat-map in Figure 1D). Comparison of the raster plots shows how non-synchronized spiking activity recorded in aCSF becomes highly synchronized in hCSF across the recorded slice area. (E) Activity patterns from cortex slice 3 (heat-map in Figure 1D). Comparison of the raster plots shows a synchronization shift in hCSF with most spikes recorded during the population burst.

