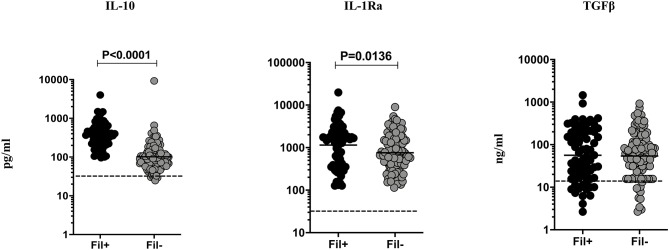
Figure 3.
Elevated plasma levels of regulatory cytokines in filarial coinfected individuals with TBL. The plasma levels of regulatory (IL-10, IL-1Ra, and TGF-β) cytokines were measured in Fil+ (n = 67) and Fil– (n = 109) individuals with TBL. The results are represented as scatter plots with each circle representing a single individual. The bar indicates the geometric mean and the significant differences were calculated using non-parametric Mann-Whitney U test. The dotted line indicates the limit of detection for each cytokine.

