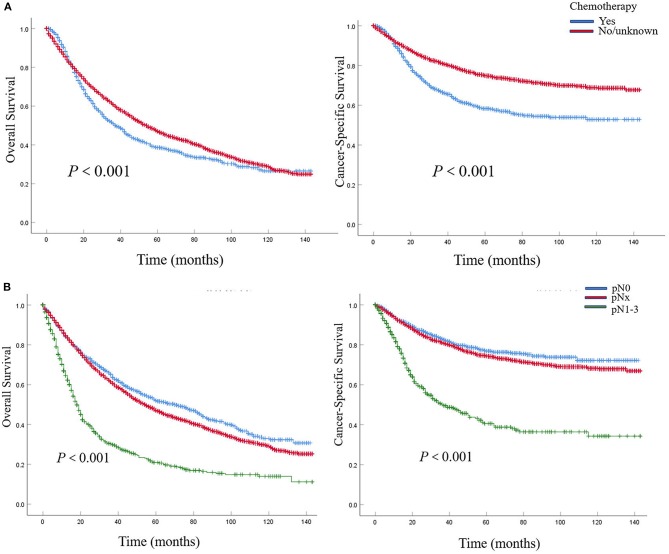
Figure 1.
Kaplan–Meier plots depicting overall survival (OS) and cancer-specific survival (CSS), after stratification according to perioperative chemotherapy record (A) and lymph node stage (B) in 7,278 patients treated with nephroureterectomy between 2004 and 2015, within the Surveillance, Epidemiology and End Results (SEER) database.

