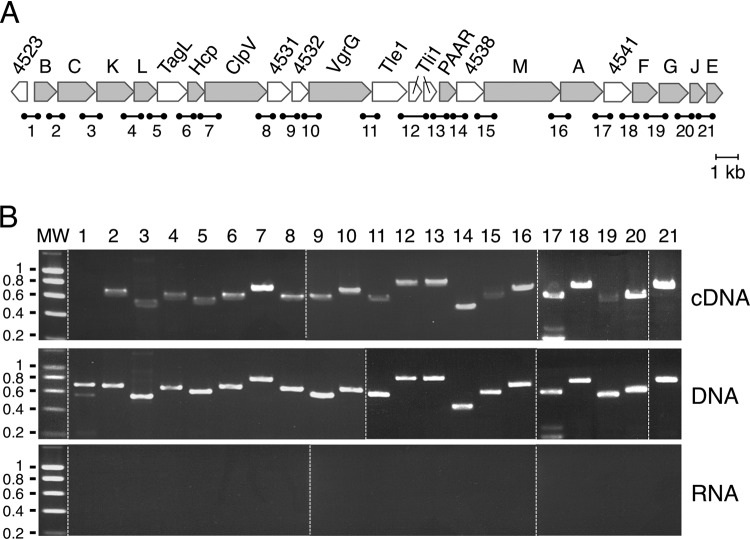
FIG 1.
Operon structure of the EAEC sci1 T6SS gene cluster. (A) Schematic organization of the EAEC sci1 T6SS gene cluster (EC042_4524 to EC042_4545). Genes encoding T6SS core components are indicated in gray. Accessory genes or genes of unknown function are represented in white. The fragments corresponding to gene junctions and amplified in the RT-PCR experiments are indicated below (1, 692 bp; 2, 672 bp; 3, 550 bp; 4, 618 bp; 5, 586 bp; 6, 643 bp; 7, 748 bp; 8, 629 bp; 9, 575 bp; 10, 654 bp; 11, 581 bp; 12, 768 bp; 13, 762 bp; 14, 459 bp; 15, 600 bp; 16, 673 bp; 17, 576 bp; 18, 720 bp; 19, 552 bp; 20, 591 bp; 21, 678 bp). (B) Operon structure of the EAEC sci1 T6SS gene cluster. Agarose gel analyses of the indicated gene junctions (numbered 1 to 21 in panel A) amplified by PCR from cDNA, genomic DNA (middle panel; positive control), and total RNA (negative control). The presence of PCR fragments in the cDNA gels demonstrates cotranscription of the genes located 5′ and 3′ of the amplified region. Molecular weight markers (MW, in kilobases) are indicated on the left. Dashed lines separate different gels combined into a single image.

