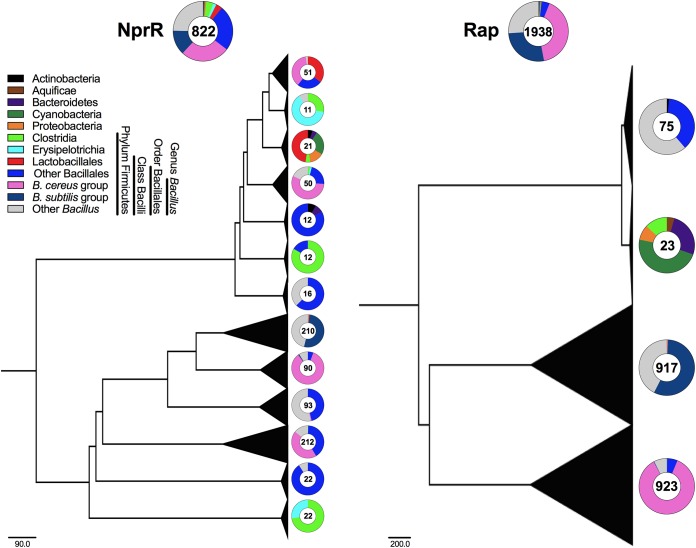
FIG 3.
Maximum-likelihood phylogenetic trees showing the distributions of NprR- and Rap-like proteins across the domain Bacteria. The sequence data set was obtained from a previous work (16), and sequences from unknown organisms were excluded (File S1). Triangles indicate collapsed branches, and the triangle area is proportional to the number of sequences collapsed. The total number of sequences and their percentage are shown on top of each tree; the number of sequences and their percentages in each taxon are shown on the right of each collapsed branch. Scale bars indicate the number of substitutions per site.

