FIGURE 5.
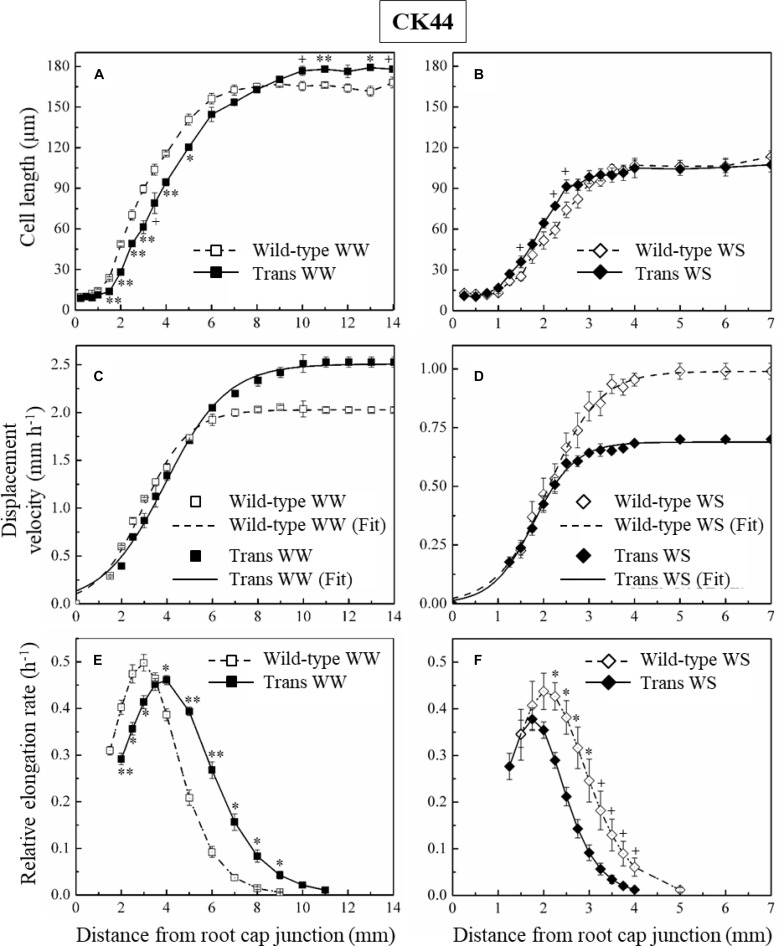
Cortical cell length profiles (A,B), displacement velocity profiles (C,D), and relative elongation rate profiles (E,F) as a function of distance from the root cap junction in the primary root of CK44 oxalate oxidase transgenic (Trans) and wild-type lines growing under well-watered (WW) or water-stressed (WS; –1.6 MPa) conditions. (In the water-stressed roots, cell lengths were also measured from 8 to 10 mm from the apex, but are not shown for clarity). Derivatives of sigmoidal curves fitted to the displacement velocity profiles of individual roots were used to obtain the mean relative elongation rate profiles. For clarity, only the curves fitting the mean velocity profiles (Fit) are shown, for which the goodness of fit (R2) was >0.99 in all cases. Roots were harvested 48 h after transplanting to well-watered conditions and 72 h after transplanting to water-stressed conditions; values are means ± SE of three to four roots. Significant differences between the transgenic and wild-type lines are shown for the cell length and relative elongation rate data (t-test; +P < 0.1; ∗P < 0.05; ∗∗P < 0.01). The experiments were repeated with similar results.

