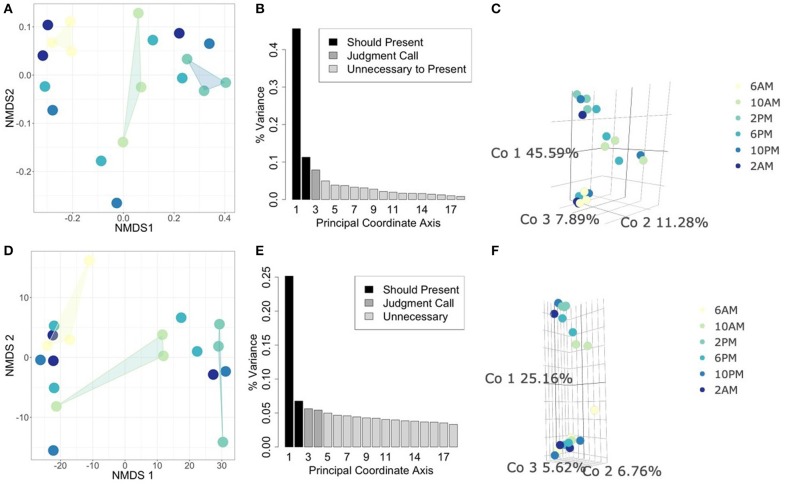
Figure 3.
Comparing statistical ordination techniques for 18S community compositions across samples. (Top row) Ordinations using Jaccard distance for comparison of presence/absence of community members between samples. (Bottom row) Ordinations using Euclidean distance on isometric log-ratio transformed data. (A,D) Non-metric Multidimensional Scaling (NMDS) projection in two dimensions, arbitrary units. Convex hulls have been drawn to emphasize ordinal separation of 6 AM (yellow), 10 AM (light green), and 2 PM (teal) samples. (B,E) Scree plots for PCoA ordinations. Each bar corresponds to one axis of the PCoA, the height is proportional to the amount of variance explained by that axis. We decided the first 3 axes were necessary to summarize the data in these cases [explaining a total of (B) 64.76% and (E) 37.54% of the variance]. Shading of bars indicate our interpretations of which axes are important to show (black), which are unimportant (light gray), and which are intermediate cases (medium gray). (C,F) PCoA ordinations using the selected axes after scree plot examination. Each point is one sample, the color of the point indicates the time of day at which the sample was taken (colors correspond to NMDS projections).

