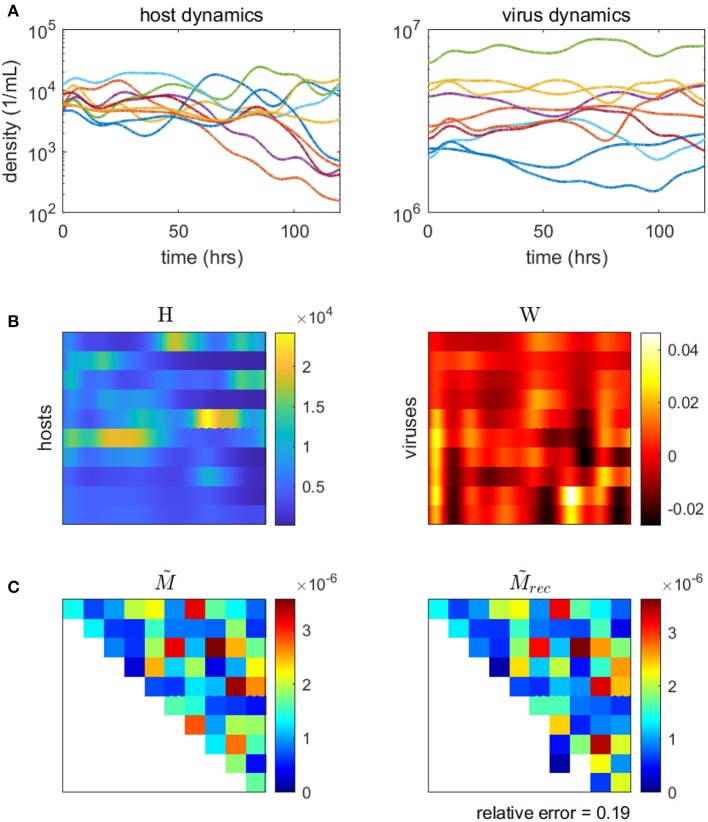
Figure 6.
Inferring the microbe-virus infection network from time-series data for a 10 by 10 synthetic microbe-virus community. (A) Simulated host (left) and virus (right) densities over time. (B) Host densities (left, H) and transformed virus differences (right, W), for input into the objective function (Equation 20). (C) The original “ground-truth” interaction network (left) and the reconstructed network (right). In the interaction matrix, the rows denote hosts, the columns represent viruses, and the colors denote the scaled intensity of interactions (where white denotes no interaction).

