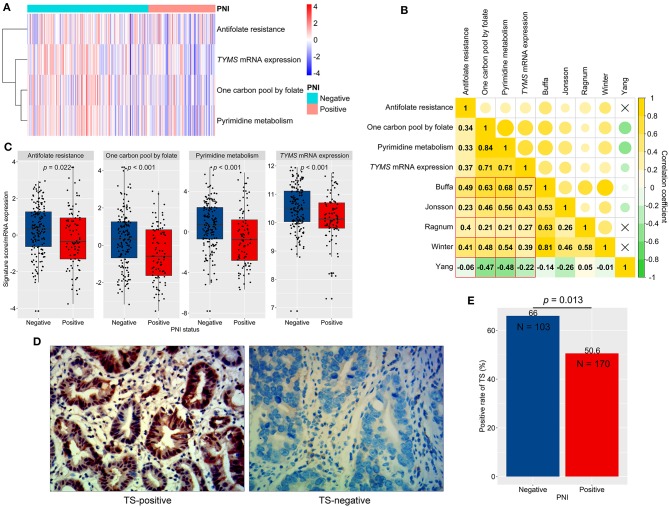
Figure 6.
Signaling scores, thymidylate synthetase (TS, TYMS) expression, and perineural invasion (PNI). (A) A clustered heat map for signaling scores and TYMS expression in ACRG. (B) The correlations between hypoxia scores (signature authors are shown) and signaling scores (Spearman correlation coefficients were shown and a fork mark indicated non-significant correlation). (C) Differences in signaling scores and TYMS expression between PNI-positive and PNI-negative GC. (D) Typical micrographs of TS-negative and TS-positive tumors, at 400× magnification. (E) Different positive rates of TS between PNI-positive and PNI-negative GC. GC, gastric cancer; ACRG, Asian Cancer Research Group.

