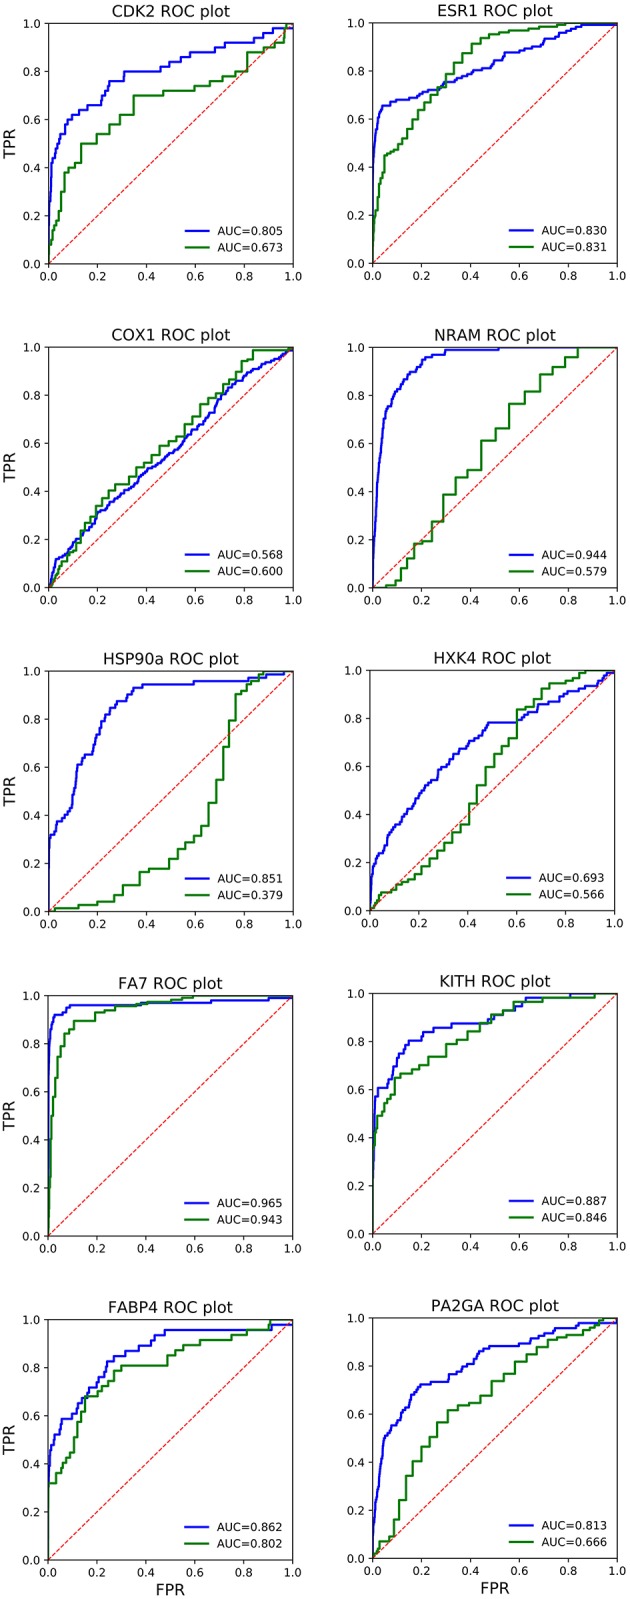
Figure 1.

Receiver operating characteristic (ROC) plots of AutoDock Vina (red line) and QM-scoring QMDS2d (blue line) for the 10 systems studied. The dotted line corresponds to random selection (AUC = 0.5). FPR, False Positive Rate; TPR, True Positive Rate; AUC, Area under the curve.
