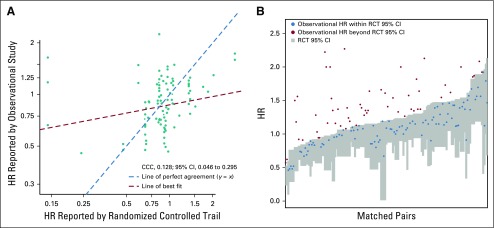
FIG 2.
Comparison of hazard ratios (HRs) reported by rigorously performed, well-matched observational studies and randomized trials. (A) Scatter plot of HR reported by observational study versus randomized controlled trial (RCT) for each matched pair (n = 121). x- and y-axes presented on log scale. Red dashed line represents the line of best fit; teal dashed line represents where the line of best fit would be if the HRs from the observational study and RCT were equal. (B) RCT HR 95% CI (gray boxes) with observational study HR estimates (red and blue dots). Matched pairs ordered by the upper CI limit of RCT. HRs were inverted as necessary to ensure that both HRs were reported relative to the same reference treatment and that the observational HR was greater than the randomized trial HR. HR < 1 indicates improved survival with the comparator treatment compared with the reference. CCC, concordance correlation coefficient.

