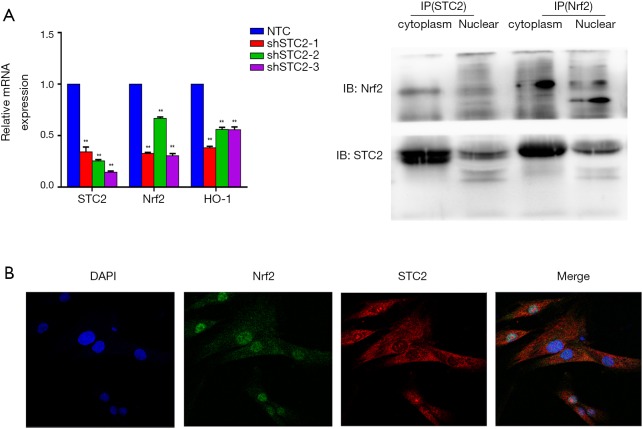
Figure 2.
STC2 colocalized with Nrf2 in MSCs. (A) The relative mRNA expression levels of STC2, Nrf2, and HO1 were analyzed by quantitative polymerase chain reaction (qPCR); (B) distributions of STC2 and Nrf2 in MSC were examined by a confocal fluorescence microscope; (C) the association of STC2 and Nrf2 was analyzed by CO-IP. shSTC2 vs. NTC, **, P<0.05. IP, immunoprecipitation; STC2, stanniocalcin-2; MSC, mesenchymal stem cell.

