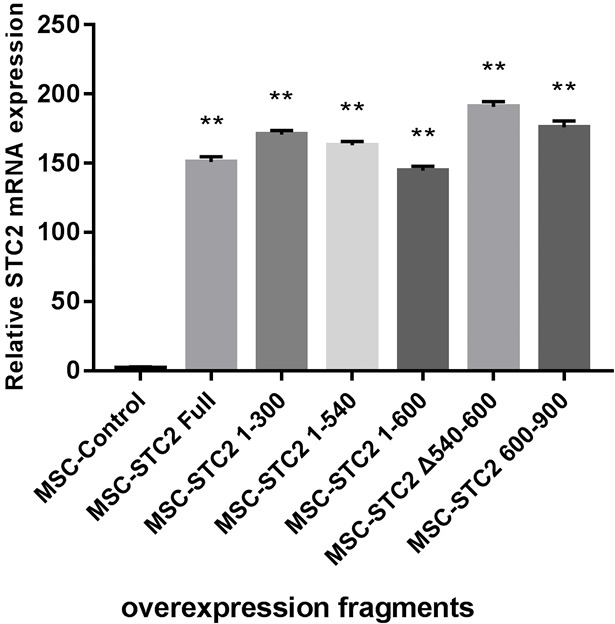
Figure S3.

The diagrammatic sketch of overexpressed constructs of STC2 in MSCs. The relative mRNA expression levels of STC2 were analyzed by qPCR and normalized with reference GAPDH controls. Multiple t-tests were used in comparison between each overespressed genotype and MSCcontrol (n=3 for each group). Data are shown as mean ± SD. **, P<0.01. MSC, mesenchymal stem cell; STC2, stanniocalcin-2; qPCR, quantitative polymerase chain reaction.
