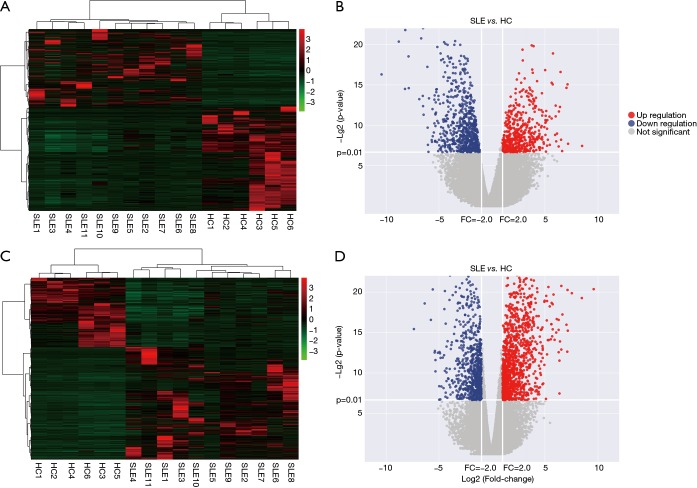
Figure 1.
Expression profiles of lncRNAs and mRNAs in SLE patients and HCs. (A,C) Heat map showing hierarchical clustering of lncRNAs and mRNAs with expression changes greater than two-fold and P value <0.01. SLE patient group: SLE1-11; healthy control group: HC1-6. Red and green colors represent up- and downregulated genes, respectively; (B,D) Volcano plot of differentially expressed lncRNAs and mRNAs. The horizontal white line represents a P value of 0.01, and vertical white lines represent 2.0-fold changes up and down. X axes are the fold change values (log2 scaled), and Y axes are the P values (log2 scaled). Red and blue plots represent up- and downregulated genes, respectively.

