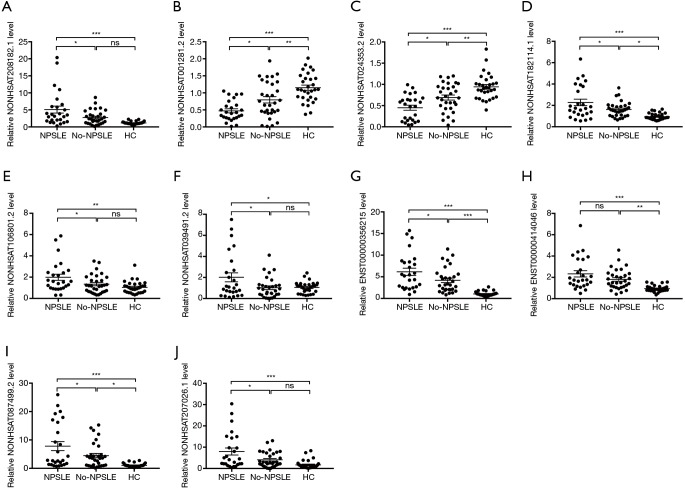
Figure 3.
Relative expression levels of ten selected lncRNAs in PBMCs of NPSLE patients, Non-NPSLE patients and HCs identified using qRT-PCR. (A,D,E,F,G,I,J) the expression levels of seven lncRNAs (NONHSAT208182.1, NONHSAT182114.1, NONHSAT106801.2, NONHSAT039491.2, ENST00000356215, NONHSAT087499.2 and NONHSAT207026.1) were significantly upregulated NPSLE patients compared to Non-NPSLE patients; (B,C) the expression levels of two lncRNAs (NONHSAT001281.2 and NONHSAT024353.2) were significantly downregulated in NPSLE patients compared to Non-NPSLE patients; (H) the difference in lncRNA ENST00000414046 was not significant. n(NPSLE)= 26, n(Non-NPSLE) =31, n (HC) =30. *, P<0.05; **, P<0.01; ***, P<0.001.

