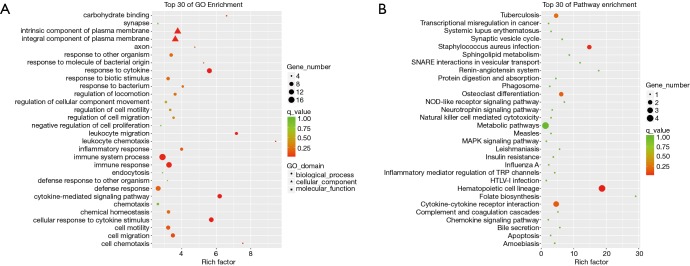
Figure 6.
Enrichment analysis of GO terms and pathways for DE mRNAs between NPSLE and Non-NPSLE group. (A) The top 30 GO analyses which consisted of significant molecular function, cellular component and biological process of DE mRNAs; (B) significantly enriched pathways of DE mRNAs. P <0.01, FC >2.0 or <−2.0.

