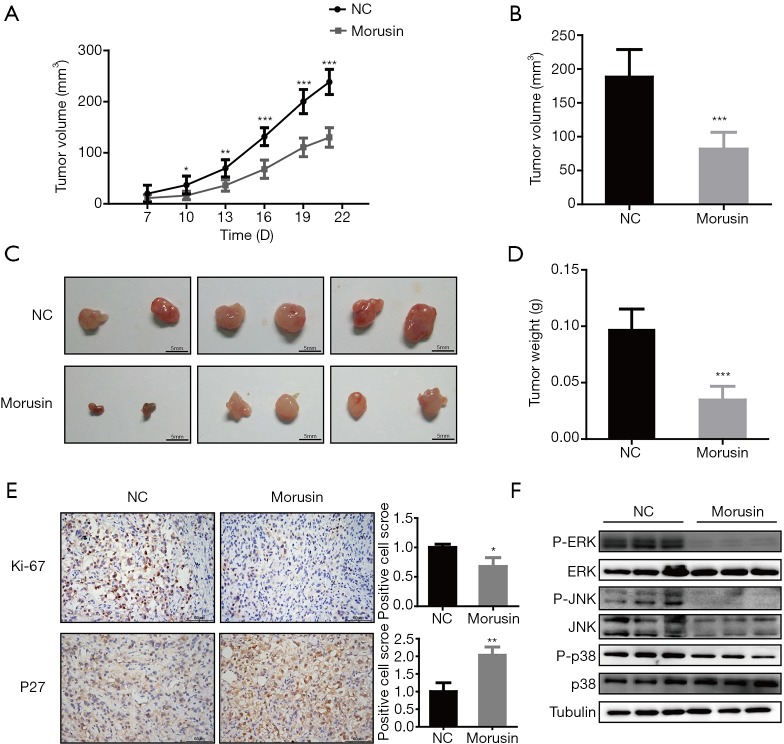
Figure 6.
Morusin inhibits human renal cell carcinoma growth in vivo. (A) Xenograft tumor volume growth during the treatment period. (B) Volume difference in negative control and treatment group. (C) Tumor morphology in the treatment group (down) and negative control (up). (D) Tumor weight increased after 21 days of treatment. (E) Tumor immunohistochemical analysis for Ki-67 and P27. *, P<0.05, **, P<0.01, and ***, P<0.001 compared to negative control. (F) P38, JNK, and ERK induced by morusin in mice tumor. Every group has three repetition.

