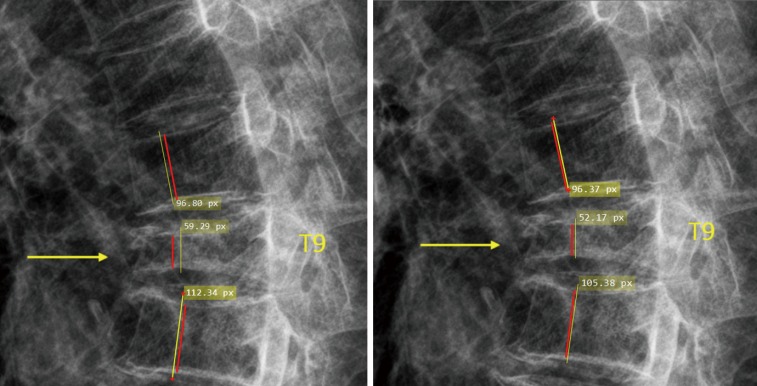
Figure S6.
To measure the height loss of T9, the height measured by the yellow line of T9 was compared with the mean height of T8 and T10 (also measured by the yellow line). However, for visual estimation, a tendency could occur that the readers take the heights denoted by red lines to estimate, which could lead to overestimation of the height loss.

