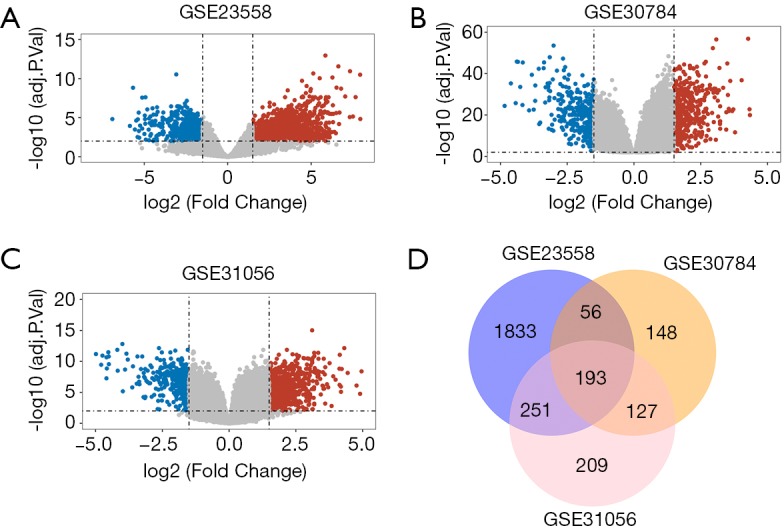
Figure 1.

Differentially expressed genes (DEGs) identification by bioinformatics analysis. (A) Volcano plot of DEGs in GSE23558. (B) Volcano plot of DEGs in GSE30784. (C) Volcano plot of DEGs in GSE31056. Red, blue and gray color indicates relatively high, low and equal expression of genes, respectively. P<0.01 and |log(FC)| >1.5 were set as the threshold. (D) Overlapping DEGs commonly screened out from three GEO datasets.
