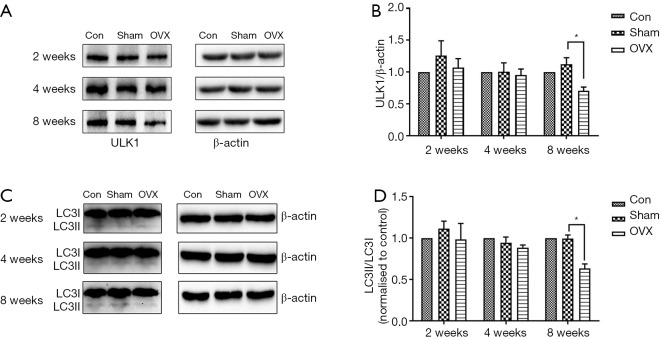
Figure 6.
Effects of estrogen deprivation on ULK1 (A,B) protein expression and the ratio of LC3II to LC3I (C,D) in the hippocampus. Data presented as the mean ± SEM. *, P<0.05 means significant difference between the OVX and Sham groups, n=4 for each group. ULK1, Unk-51-like kinase 1; OVX group, ovariectomized group; Sham group, sham-operated group; SEM, standard error of the mean.

