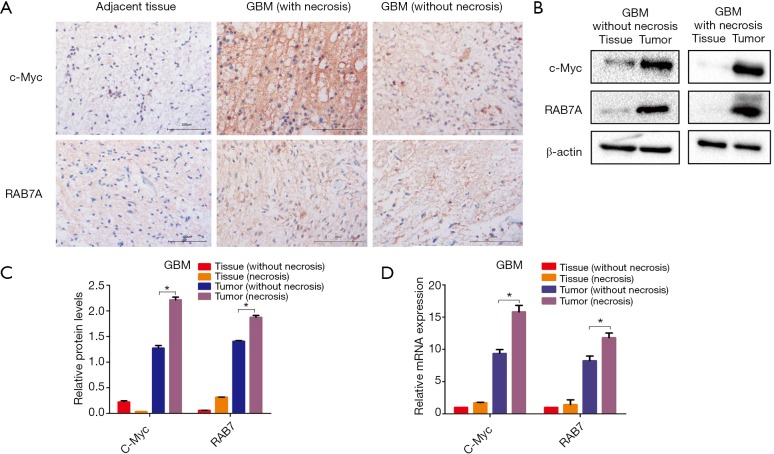
Figure 1.
High expression of c-Myc and Rab7a in GBM specimens. (A) Photomicrographs show Immunohistochemical staining of c-Myc and Rab7a protein of GBM samples with or without necrosis, and NBTs. Original of magnification ×200. Scale bars represent 100 µm; (B) Western blot analysis of c-Myc and Rab7a expression in GBM samples with or without necrosis, and their relative NBTs. β-actin is shown as the loading control; (C) graphical representation of the Western blot analysis; (D) c-Myc and Rab7a mRNA expression in GBM samples with or without necrosis, and their relative NBTs. Data are presented as mean ± SEM for three separate experiments performed in duplicate. *, P<0.05. GBM, glioblastoma multiforme; NBTs, normal brain tissues; SEM, standard error of the mean.

