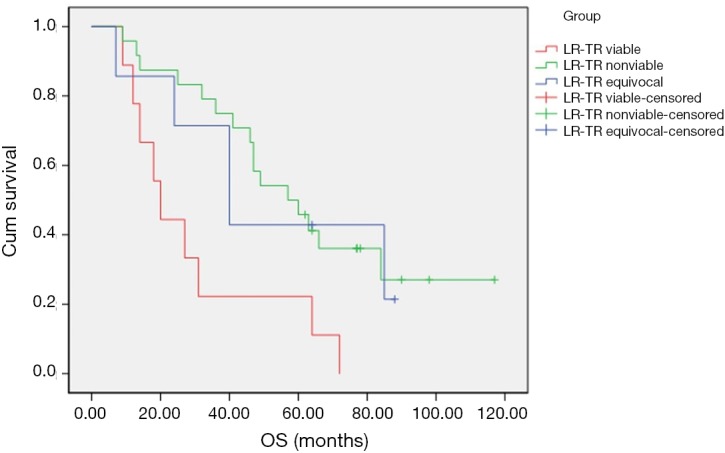
Figure 5.

Survival curves among the three LR-TR catagories. Patients classified as LR-TR viable had significantly lower OS than those classified as LR-TR nonviable (P=0.005) and LR-TR equivocal (P=0.036). However, the OS between LR-TR nonviable and LR-TR equivocal did not differ significantly (P=0.901). LR-TR, Liver Imaging Reporting and Data System Tumor Response; OS, overll survival.
