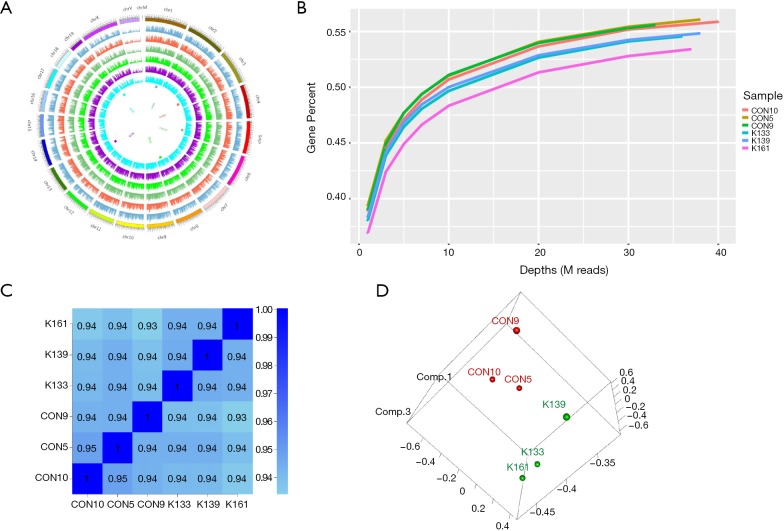
Figure 3.
RNA-seq of Dnmt3a R878H mice. (A) Genome coverage map of RNA-seq data of Dnmt3aR878H/WTMx1-Cre+ mice and Dnmt3aWT/WTMx1-Cre+ mice. (B) Saturation cryptanalysis to detect the amount of sequenced data. (C) Heatmap map of gene expression correlation, the numerical value refers to the correlation coefficient. (D) Sample PCA map based on gene expression of Dnmt3aR878H/WTMx1-Cre+ mice and Dnmt3aWT/WTMx1-Cre+ mice.

