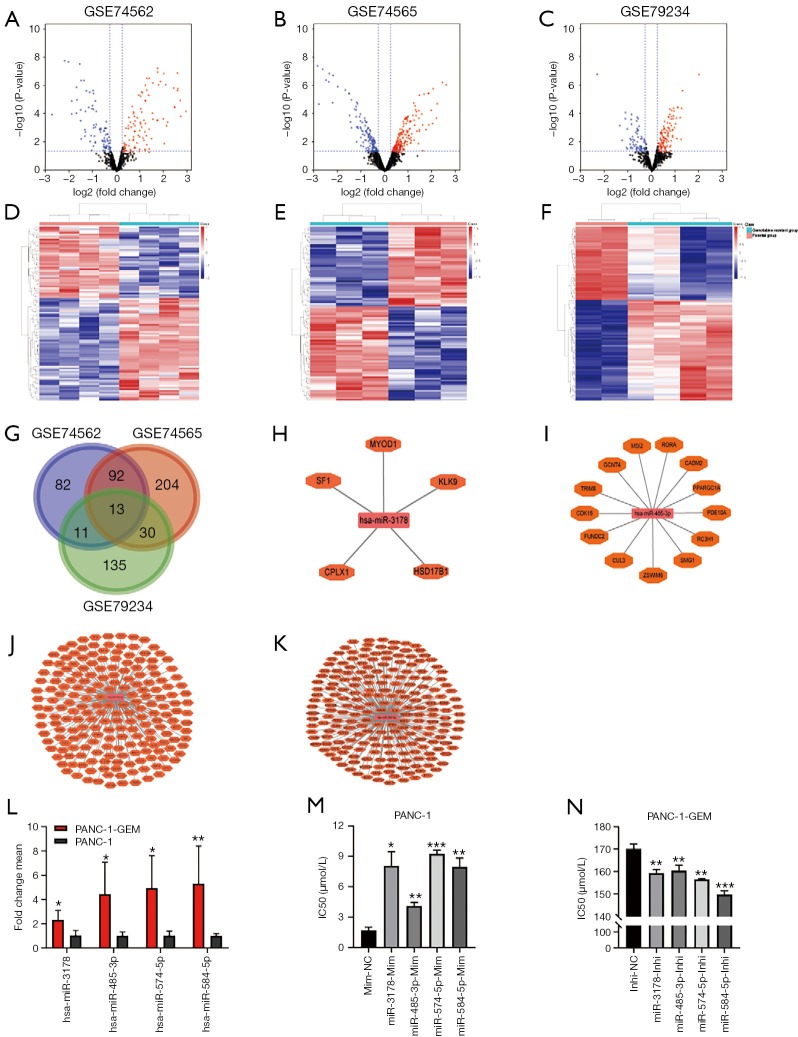
Figure 1.
DEmiRNAs between gemcitabine-resistant pancreatic cancer cells and parental cells. (A-C) Volcano plots showed DEmiRNAs in GEO datasets GSE79234, GSE74565, and GSE74562; (D-F) the cluster heatmap showed the top 100 up-regulated and top 100 down-regulated miRNAs in GEO datasets GSE79234, GSE74565, and GSE74562. Red color indicates high expression level, and green color indicates low expression level; (G) Venn diagram showed that 13 DEmiRNAs overlapped in GSE79234, GSE74565, and GSE74562; (H-K) miRNA-target gene network of hsa-miR-3178, hsa-miR-485-3p, hsa-miR-574-5p, and hsa-miR-584-5p, which had a consistent expression trend in three GEO datasets. The targeted genes were mapped into miRDB, microT, and Targetscan databases; (L) qRT-PCR analyses showed that the four miRNAs were upregulated in gemcitabine-resistant PC cells (PANC-1-GEM) compared with its parental cells (PANC-1); (M) miRNAs transfection in PANC-1 cells led to increased IC50 to gemcitabine compared to control cells; (N) knockdown of miRNAs in PANC-1-GEM cells led to decreased IC50 to gemcitabine compared to control cells. Each bar represents the mean ± SD. *, P<0.05; **, P<0.01; ***, P<0.001. PANC-1-GEM, gemcitabine-resistant PANC-1 cells; IC50, half-inhibitory concentration; Inhi-NC, inhibitor negative control; Mim-NC, mimic negative control.

